Troubleshooting .NET Apps on Cloud Foundry: Logs, Metrics, and Remote Debugging

Using a debugger isn’t always the right pill to take. For instance, a debugger may suspend execution, thus reproducing not all the issues in effect. So, what are the options when you can’t fully rely on a debugger?
In this blog post, we share our experience of troubleshooting .NET applications employing logs and custom log scopes collected and aggregated by Cloud Foundry. In addition, we overview how general and app-specific metrics—such as requests per action, a number of concurrent threads, login attempts, etc.—can help to enable preventive maintenance. Finally, you will learn what key steps one needs to follow to remotely debug an app.
Troubleshoot using only logs
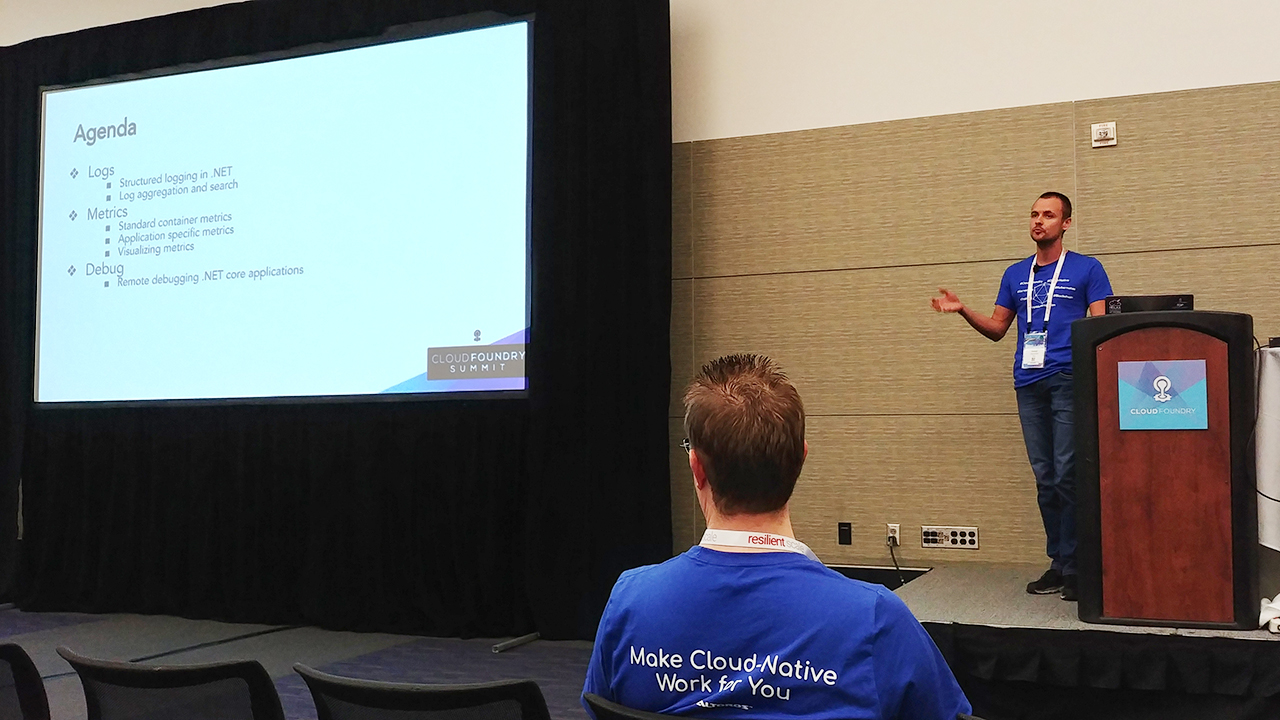
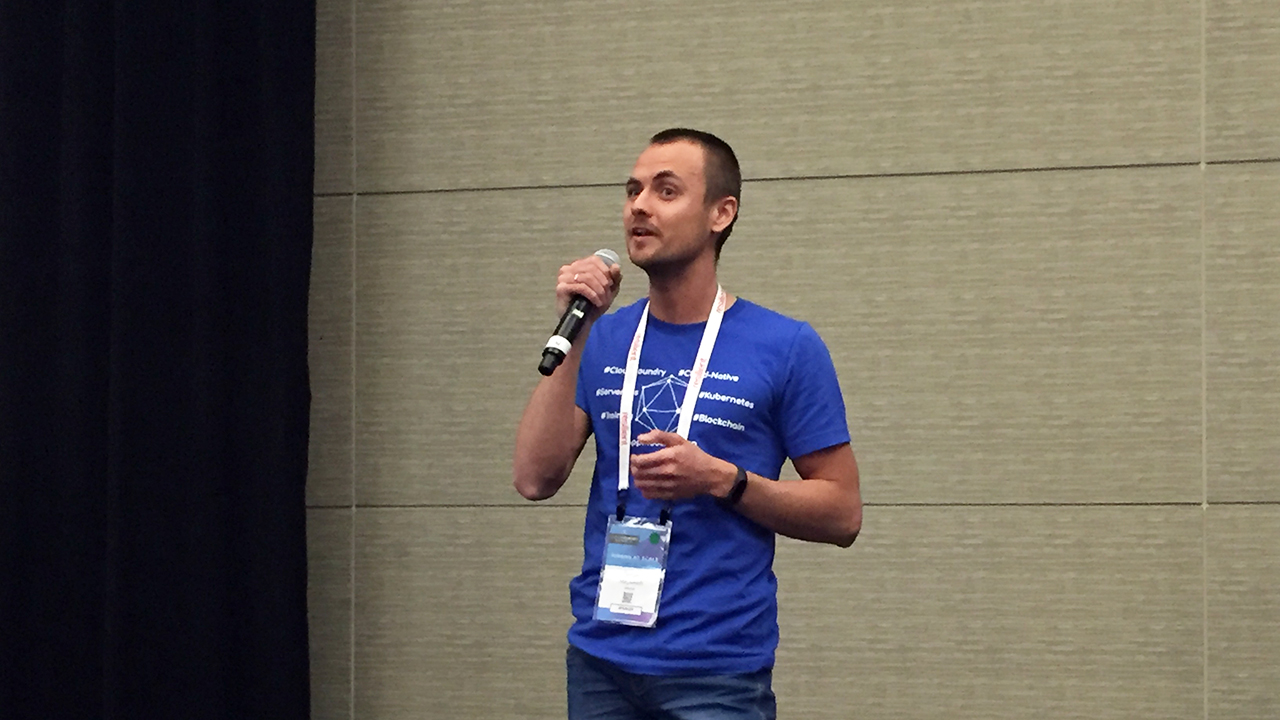
Sergey Matyukevich of Altoros was one of the speakers during Day 2 of the Cloud Foundry Summit 2018 in Boston. In his presentation, Sergey introduced attendees to debug .NET apps on Cloud Foundry by using logs and metrics.
“Any issue can be fully troubleshooted using only logs.” —Sergey Matyukevich
To start off, Sergey explained that debugging often begins with reading through logs. Cloud applications typically emit log messages to stdout or stderr. Log messages are usually JSON objects that have a structured format like the example below.
{
        "Msg" : "Request started",
        "Level" : "INFO",
        "RequestId" : "0c28701b-e4de-11e6-8936",
        “UserId” : 345,
        “Url” : “/user-profile/save”,
        “RequestParameters” : { “Name”: “user1”, “Age”: 22 }
}
With Cloud Foundry, developers have the option to choose which log to use from Console.Write(), the simplest logging tool, to the already existing logging libraries like Serilog or even custom logs.
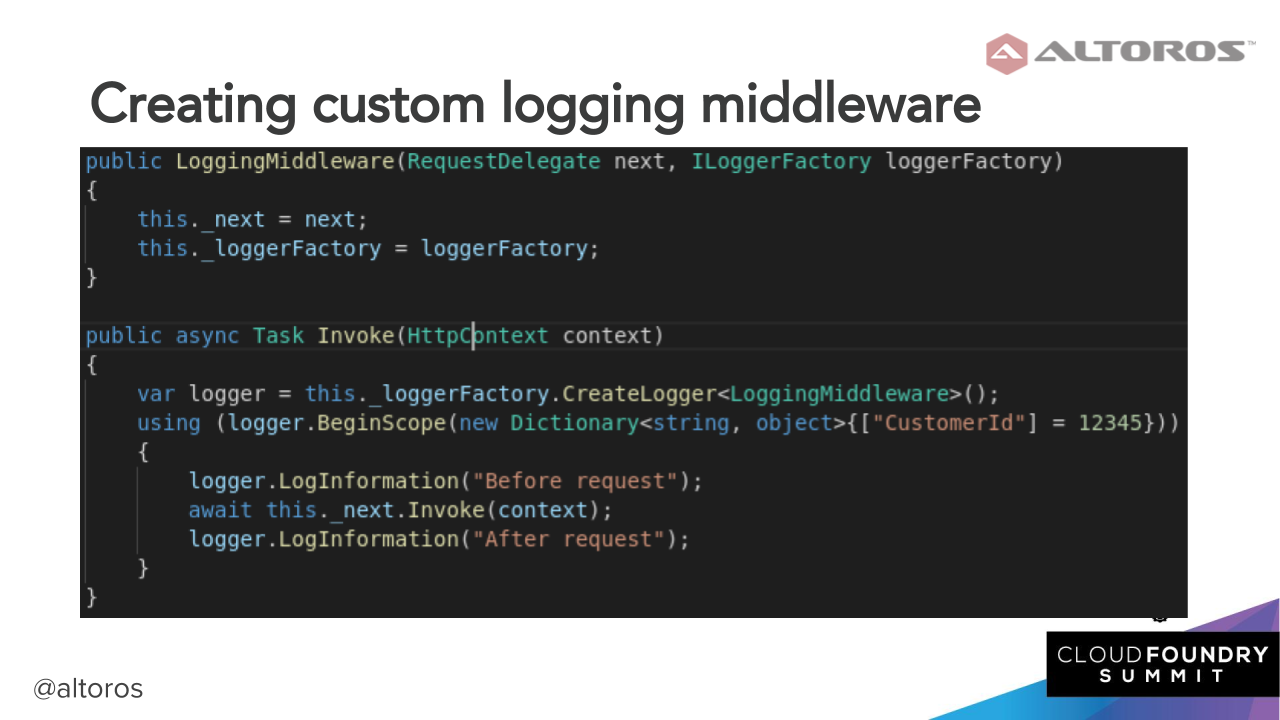
An example of a customized log
Sergey emphasized the importance of using log scopes as they ensure a consistent logging format and allow for moving most of the logging code to specialized classes (filters, middleware, etc.). Each log message transparently receives the properties of all parent scopes attached to it.
Custom log scopes can also be created to include specific data. Ideally, the RequestId, UserId, and ThreadId fields should be logged, as well as the following one-off events:
- Request info (path, parameters, and query parameters)
- Exception info (exception type and stack trace)
- Database queries (query type, query text, table name, and parameters)
- External service requests (URL and parameters)
- Entry and exit to/from major components and services
Finally, with logs properly configured, you can start off troubleshooting some issue. One way to do so is to find the log line indicating an error. What one needs is to copy the RequestId field and filter all logs with that value. Then, you analyze the request parameters and, if necessary, use it to reproduce the error.
Preventive maintenance with metrics
While logs are generally good for fixing issues, employing metrics can help to prevent errors from even occurring. According to Sergey, general metrics fall under two categories:
- Container metrics (CPU, memory, disk, etc.)
- Network metrics (requests, response, response time, etc.)
“Logs are used for troubleshooting, but the main use case for using metrics is preventive maintenance.” —Sergey Matyukevich
Aside from the general metrics mentioned, Sergey also pointed out the importance of monitoring such app-specific metrics as:
- Error number
- Requests per action
- Database requests (per table and per action)
- A number of concurrent threads
- Execution time (total and for database queries)
- Login attempts
To get the most out of these metrics, alerts need to be configured, so that errors can be predicted and, more importantly, prevented.
In any Cloud Foundry deployment, logs and metrics make the task of debugging easier. Tools like Logsearch or Kibana help to simplify the analysis of your logs and metrics. One may also utilize Heartbeat—a full-stack monitoring tool that provides operators and developers with a 360-degree live view on their Cloud Foundry deployments.
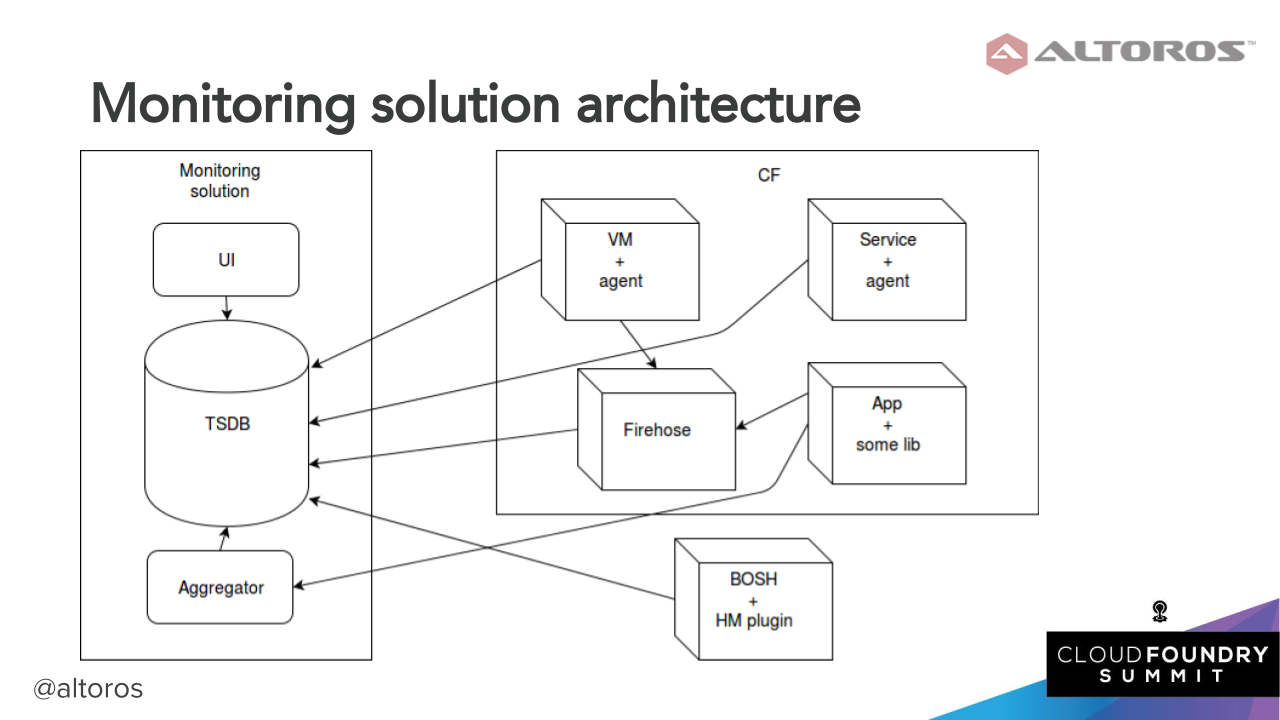 How monitoring solutions measure metrics in Cloud Foundry
Another tool to employ is Altoros Log Search, which extends the capabilities of the ELK stack (Elasticsearch, Logstash, and Kibana) to enable centralized, role-based, and reliable management of system and application logs from a Cloud Foundry deployment. The solution comes with pre-built Kibana dashboards and Logstash parsing rules, as well as with index templates adapted specifically for Cloud Foundry.
Remote debugging
Sergey also outlined some key steps to take to remotely debug a .NET app on Cloud Foundry.
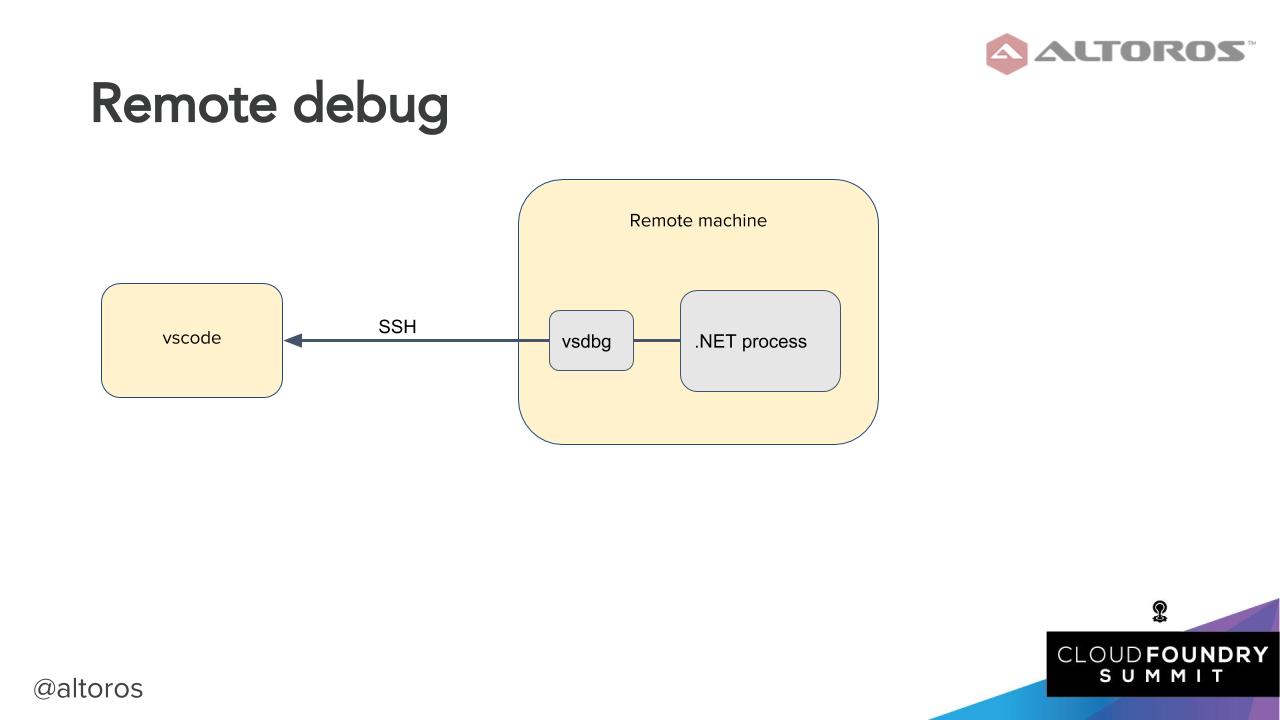
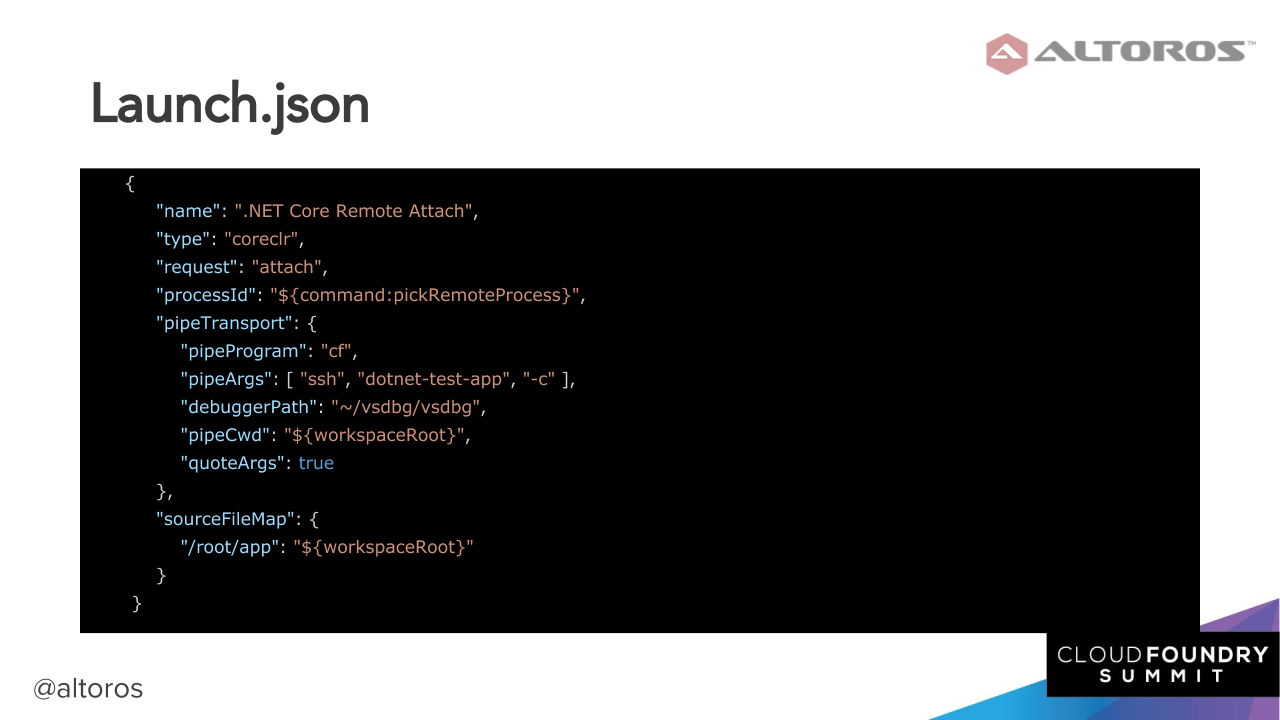
The first thing to do is to launch vsdbg (the .NET Core command line debugger) inside vscode (Visual Studio Code—Microsoft’s source code editor) and configure the debugger using a JSON file.
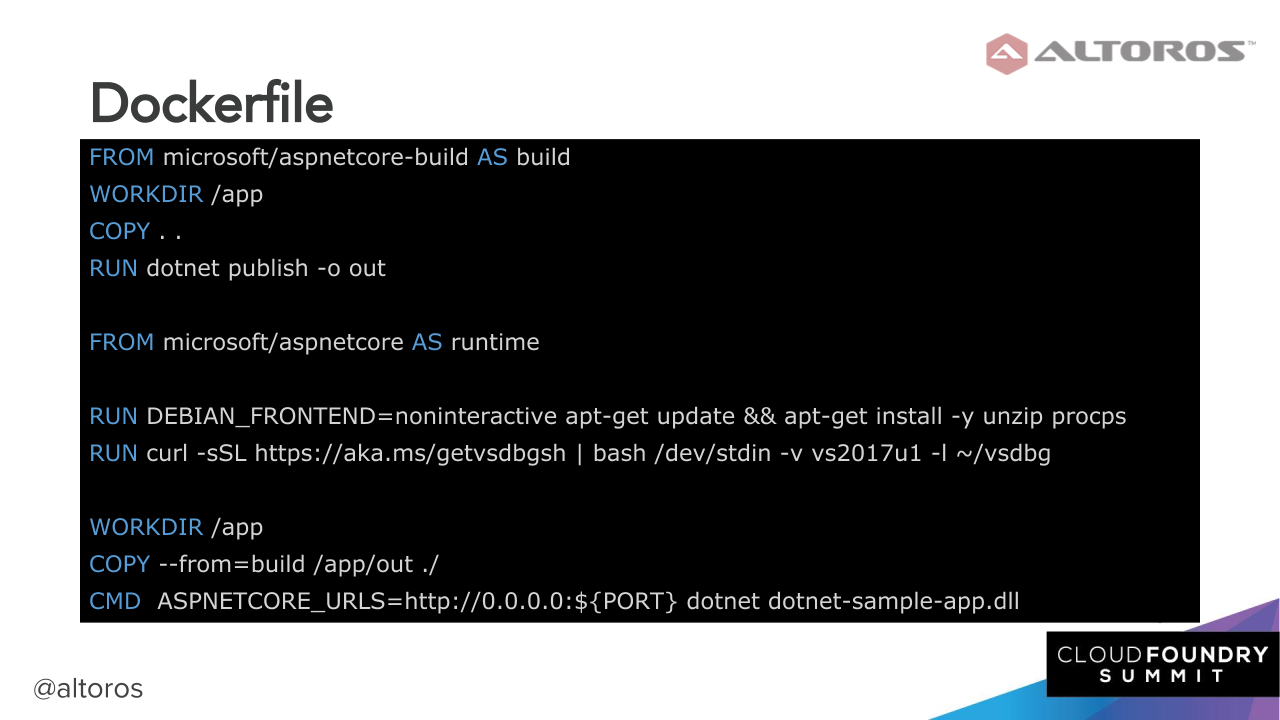
Then, one needs to dockerize an app, with vsdbg up and running inside a Docker container.
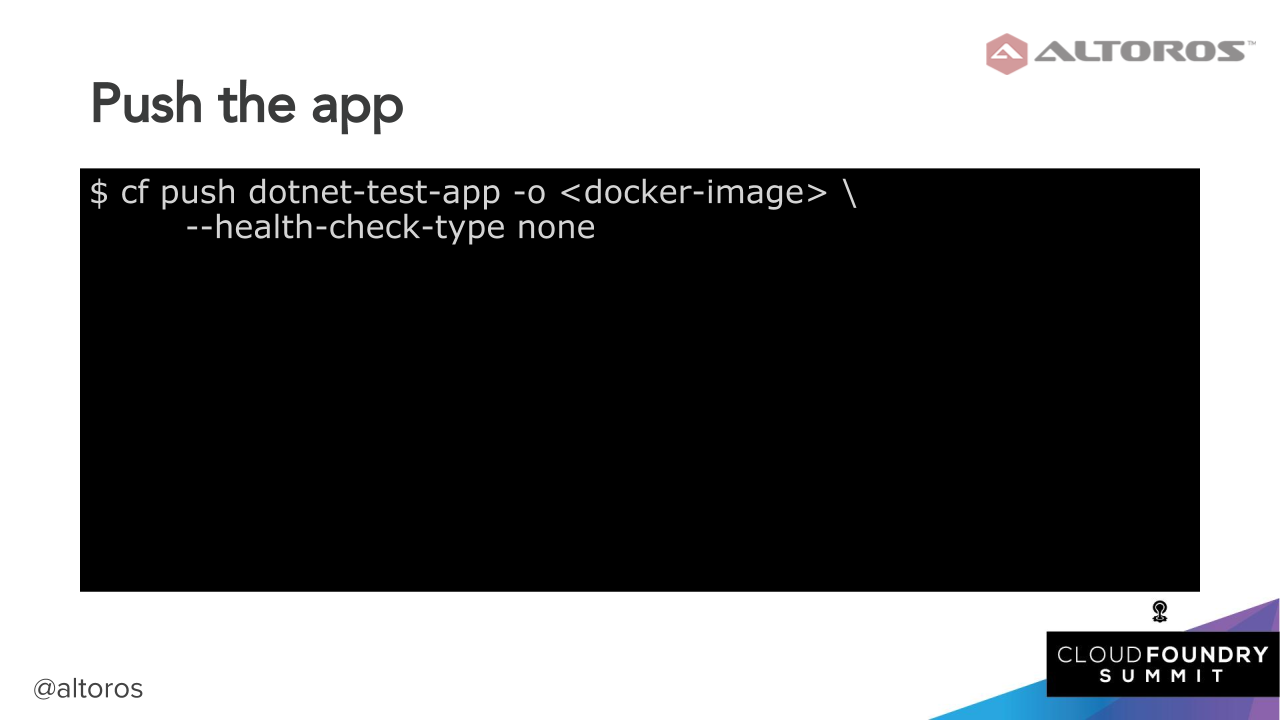
Using a Docker image, you push the application into Cloud Foundry by running the cf-push command.
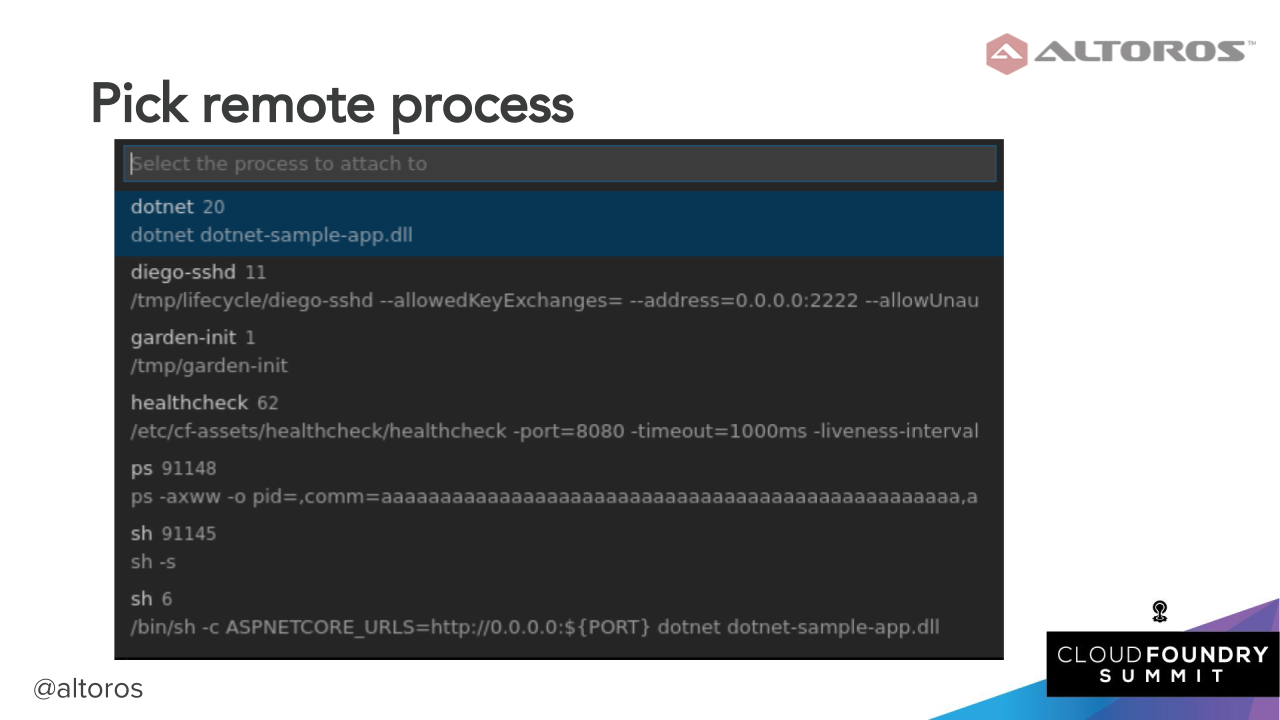
On pushing the app, we can finally choose a process we want to debug. To initiate remote debugging on Windows, you deploy a “debugger” virtual machine in Cloud Foundry’s internal network and employ the Remote Desktop Protocol to connect to a Diego cell and attach the debugger to a running process.
Sergey warned the attendees not to overuse remote debugging. For instance, he noted that a need to remotely debug in production might indicate a problem with the application logging architecture. Sergey also stressed that not all the issues can be resolved with remote debugging, for example:
- Remote debugging is useless for post issues.
- Remote debugging suspends execution, that’s why not all issues are reproducible under a debugger.
You can find the source code of a sample .NET app troubleshooted and remotely debugged on Cloud Foundry in this GitHub repo.
Want details? Watch the videos!
Table of contents
|
In this next video, Zach Brown of Pivotal and Sergey Matyukevich of Altoros provide a brief introduction into a cloud-native .NET track.
Related slides
Further reading
- Cloud Foundry Deployment Metrics That Matter Most
- Using Centralized Logs and Metrics to Monitor Cloud Foundry Across All Levels
About the expert