Cloud Foundry Deployment Metrics That Matter Most

Generating a variety of metrics
Lots of metrics per se do not necessarily imply lots of value for monitoring. If you have been working with monitoring systems for quite a while, you may have noticed that the metrics you get can be roughly divided into the following three groups:
- Simple, clear, and easily understandable metrics (15–20%*).
- Metrics that are mostly useless from an operator’s perspective, but may come in handy for developers during application debugging (65–75%*).
- Metrics that appear to be useful, but are difficult to interpret (10–15%*). They can be really valuable in case you are totally aware of how the system works and what exactly is being measured.
Note: *The figures are based on the author’s experience and represent his viewpoint.
Being a complex system comprising several distributed components, Cloud Foundry produces a great variety of metrics. Let’s take a look at those of them that are most valuable, including those that are best suited for triggering alerts.
A Cloud Foundry deployment can emit metrics at the infrastructure, platform, and application levels.
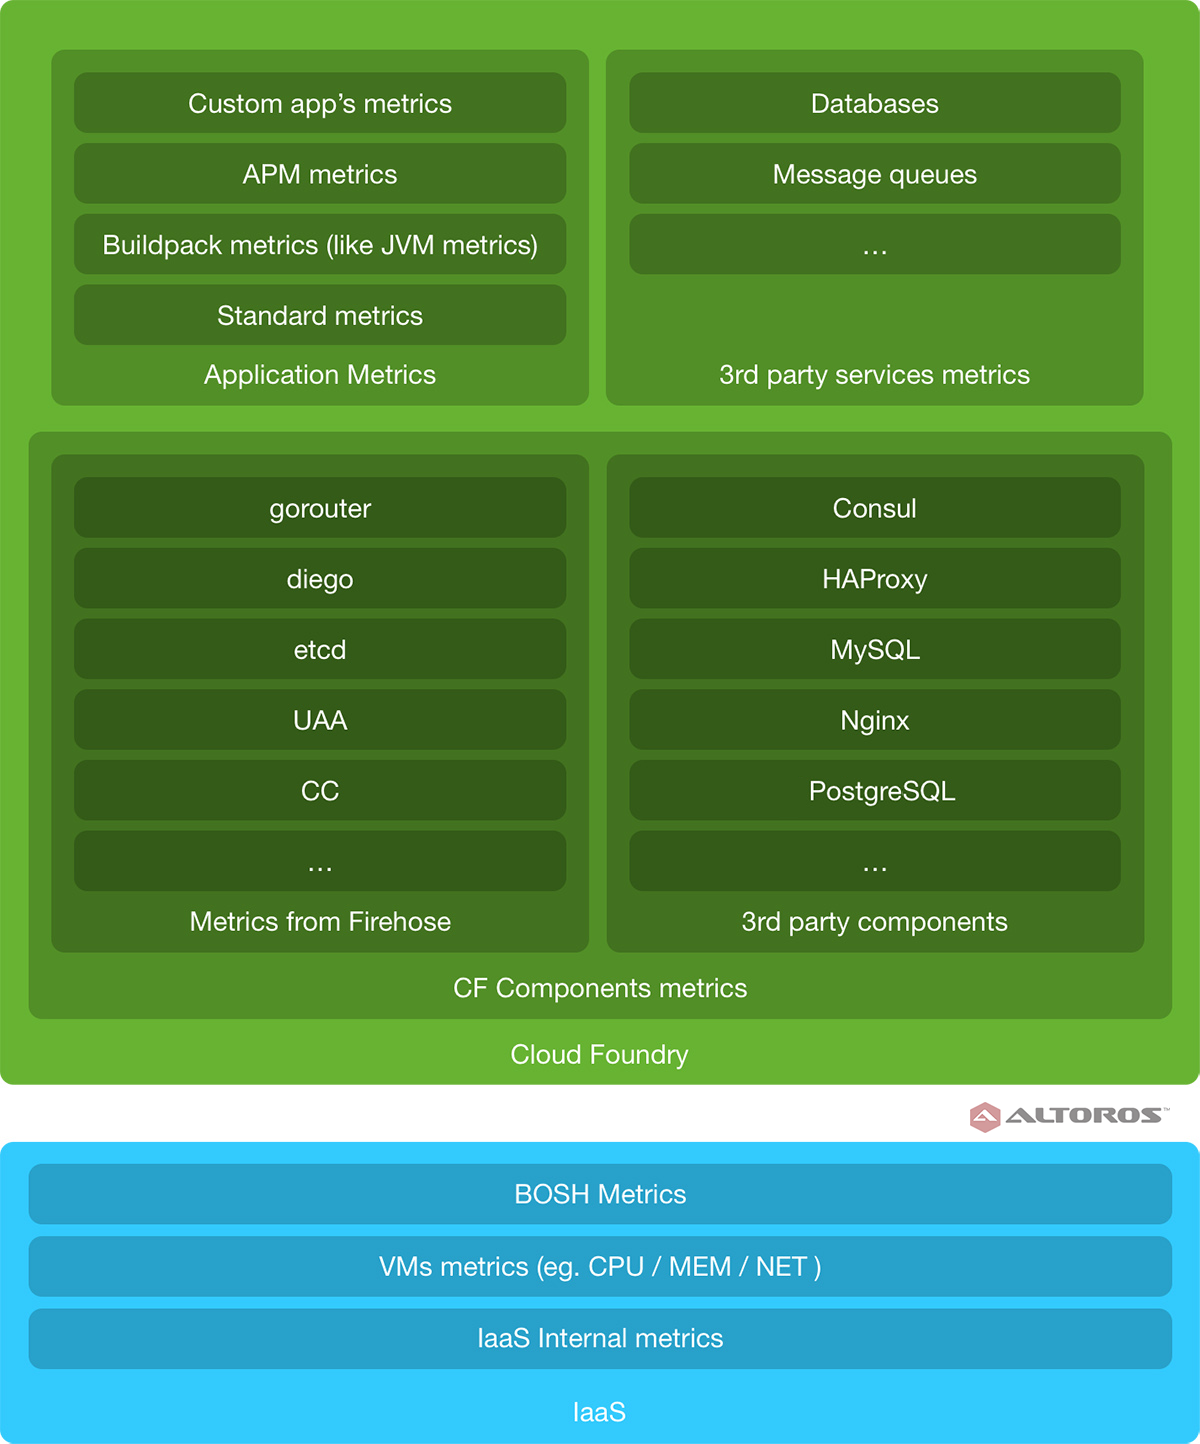 A Cloud Foundry deployment: Layers of monitoring
In this blog post, we will start with evaluation of metrics emitted at the infrastructure level and move up the abstraction scale to application metrics.
Virtual machines (VMs) and BOSH
BOSH has a monitoring component—the Health Monitor—that collects metrics from the BOSH Agents at all BOSH-deployed virtual machines.
Note: To retrieve metrics from a BOSH Agent, one can use the following tools:
- Health Monitor plugins
- BOSH HM Forwarder
- PCF JMX Bridge (for PCF only)
Below are the metrics that can be collected while running virtual machines.
VM health
| Metric | Description |
|---|---|
system.healthy | The simplest VM health metric. As its name suggests, the metric indicates the health of a virtual machine from the BOSH perspective (a VM is up, and all the processes on it are running). This metric is an ideal candidate for setting up alert thresholds. |
CPU
| Metrics | Description |
|---|---|
system.cpu.user | The percentage of CPU utilization that occurred while executing at the user level. |
system.cpu.sys | The percentage of CPU utilization that occurred while executing at the system (kernel) level. |
system.cpu.wait | The percentage of time that a CPU(s) was idle, during which the system had to process an bulky disk I/O request. |
system.load.1m | The load average over the last minute. |
Note: These CPU metrics are most useful for Diego cells.
Memory
| Metrics | Description |
|---|---|
system.mem.percent | Memory usage in % |
system.swap.percent | Swap usage in % |
system.mem.kb | Memory usage in KB |
system.swap.kb | Swap usage in KB |
Note: These memory metrics are most useful for Diego cells.
Storage
| Metrics | Description |
|---|---|
system.disk.<type>.percent | The amount of the space used |
system.disk.<type>.inode_percent | The number of the inodes used |
Where
- system: / (root partition)
- persistent: partition for /var/vcap/store
- ephemeral: partition for /var/vcap/data
These metrics are most useful for databases.
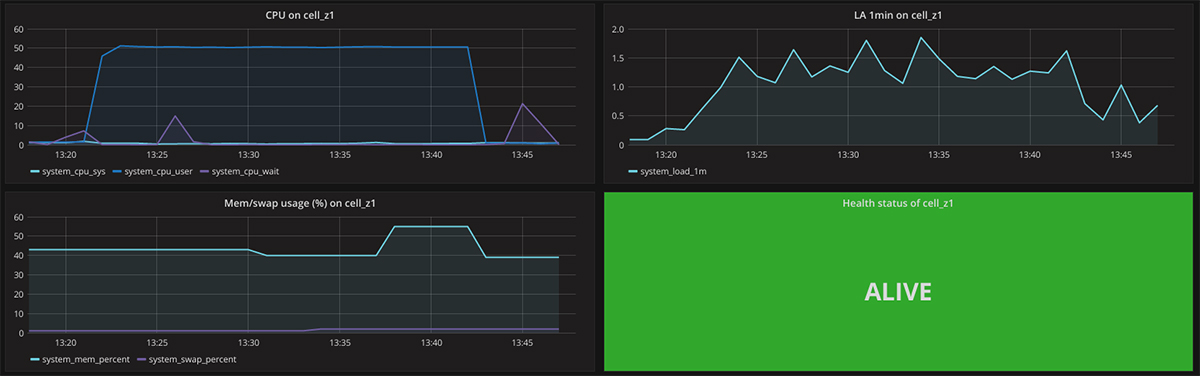 A dashboard with metrics from a specific VM (created with Hearbeat)
As you can see, the metrics monitored by BOSH are quite basic, so it makes sense to deploy a more advanced collector of system metrics to also monitor I/O (recommended for databases) or Network (recommended for Gorouter, HAProxy, and NGINX) metrics.
Cloud Foundry components
The metrics gathered from the Cloud Foundry system components are accepted by the Loggregator and transported through a chain of its units, the last being—Firehose. It further streams the received metrics via nozzles to third-party systems for processing and persistence.
Let’s look at the most valuable metrics emitted by specific Cloud Foundry components.
Gorouter
| Metrics | Description |
|---|---|
total_routes | The current number of the registered routes. The count on all the routers should be the same, so this metric is a good candidate for setting up alert thresholds. |
total_requests | The lifetime** number of the received requests. |
rejected_requests | The lifetime number of bad requests received by Gorouter. |
bad_gateways | The lifetime number of bad gateways. |
latency.<component> | The time (in milliseconds) it took the Gorouter to handle requests from each component (e.g., a Cloud Controller and UAA) to its endpoints. |
requests.<component> | The lifetime number of the requests received for each component (e.g., a Cloud Controller and UAA). |
responses | The lifetime number of the HTTP responses. |
responses.XXX | The lifetime number of the HTTP response status codes of type XXX. |
**It’s recommended to convert all the lifetime metrics to rate.
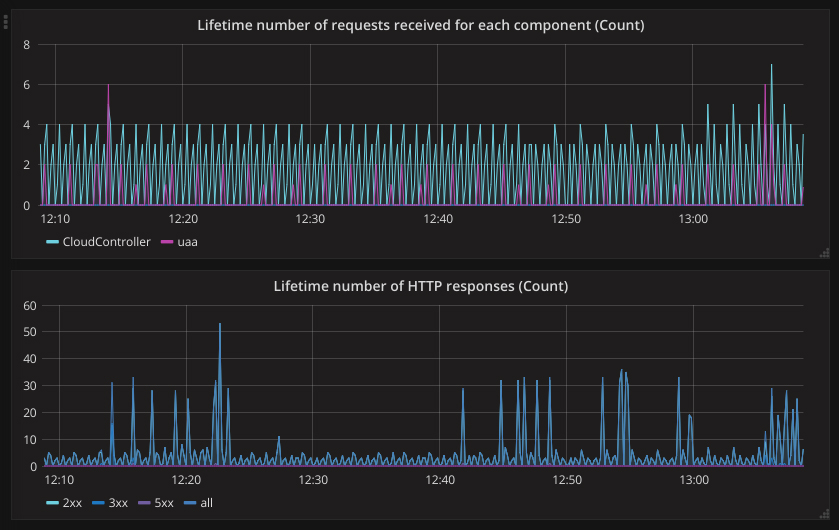 A dashboard with metrics from Gorouter
In addition, you can derive some useful metrics from the HttpStartStop event inside a nozzle.
To do so, you need to use the Uri field inside the HttpStartStop struct to get a URI, StartTimestamp / StopTimestamp to get a time interval, and StatusCode to distinguish the successfully completed responses from the failed ones.
| Metrics | Description |
|---|---|
request | The number of the successfully completed HTTP responses for a particular URL |
error | The number of the failed HTTP responses for a particular URL |
response times | Response time for a particular URL |
responses.XXX | The number of the HTTP response status codes of type XXX for a particular URL |
Diego
| Metrics | Description |
|---|---|
CrashedActualLRPs | The total number of the long-runnіng process (LRP) instances that have crashed |
LRPsMissing | The total number of the LRP instances that are desired, but have no record in the Bulletin Board System (BBS) |
LRPsRunning | The total number of the LRP instances that are running on cells |
The metrics below are good candidates for setting up alert thresholds.
| Metrics | Description |
|---|---|
RoutesTotal | The number of the routes in the route-emitter’s routing table. |
ContainerCount | The number of containers hosted on a cell. |
UnhealthyCell | Determines whether the cell has failed to pass its healthcheck against the Garden backend. “0” signifies healthy, and “1” signifies unhealthy. |
The metrics that are useful for Capacity Planning are also worth mentioning.
| Metrics | Description |
|---|---|
CapacityRemainingContainers | The remaining number of containers this cell can host. |
CapacityRemainingDisk | The remaining amount (in MiB) of the disk space available for this cell to allocate to containers. |
CapacityRemainingMemory | The remaining amount (in MiB) of the memory available for this cell to allocate to containers. |
CapacityTotalContainers | The total number of containers this cell can host. Please, note that this value is set to 250 by default). To get viable data, set the relevant value for your infrastructure. |
CapacityTotalDisk | The total amount (in MiB) of the disk available for this cell to allocate to containers. |
CapacityTotalMemory | The total amount in MiB of the memory available for this cell to allocate to containers. |
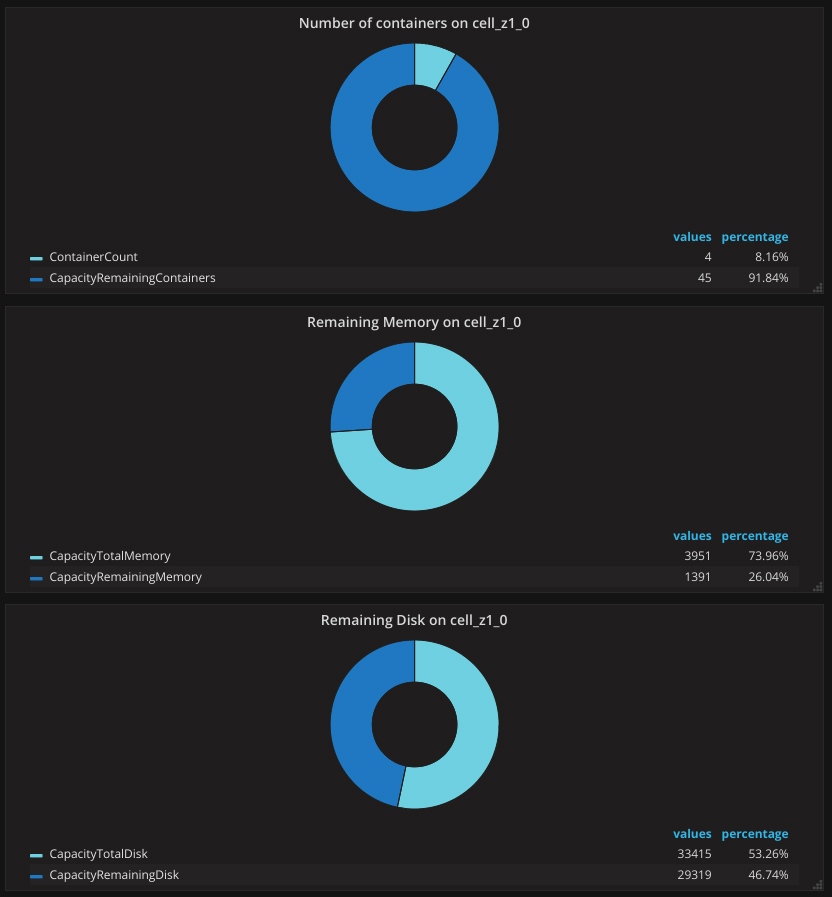 A dashboard with Diego metrics (capacity)
Etcd
| Metrics | Description |
|---|---|
IsLeader | Determines whether the host is currently the Leader |
Followers | The number of Followers the host currently has |
The fluctuation of these metrics can signify network, configuration, or Cloud Foundry upgrade issues.
Consul
Firehose does not stream metrics from Consul, so you need a third-party agent to monitor this Cloud Foundry component.
Among useful metrics are the current leader and the number of peers. The fluctuation of these metrics can signify network, configuration, or Cloud Foundry upgrade issues.
Furthermore, Consul stores the results of the service health checks. You can visualize these results on a single dashboard and attach alert rules (based on the service status and the above described metrics) to it.
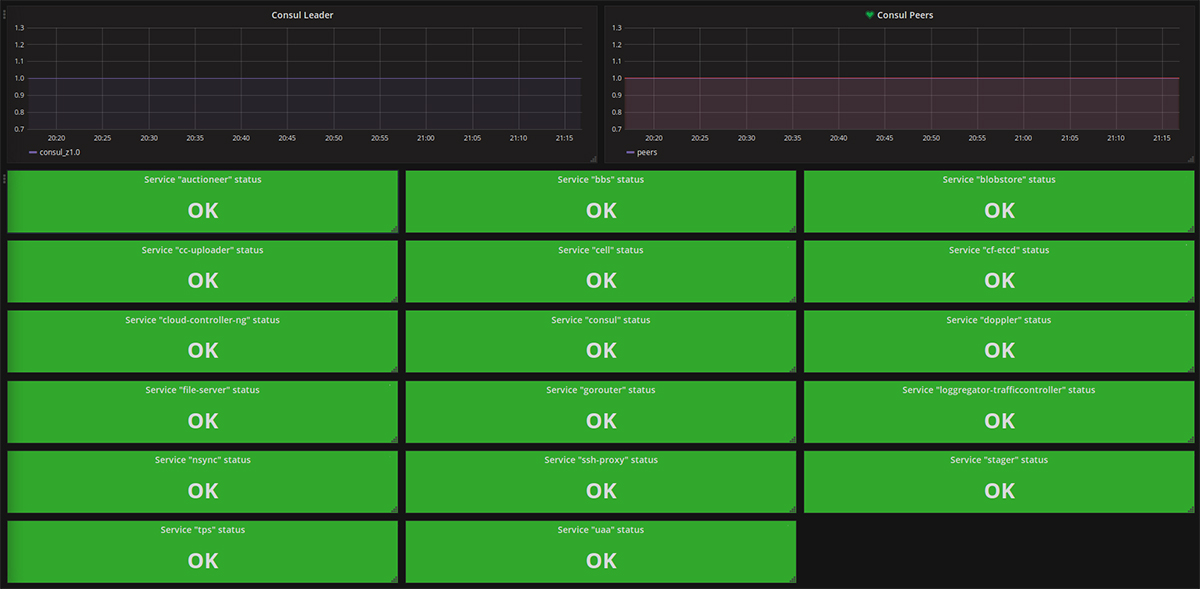 A Consul monitoring dashboard
Cloud Controller
| Metrics | Description |
|---|---|
total_users | The total number of users ever created, including inactive users. |
http_status.XXX | The number of the HTTP response status codes of type XXX. It makes sense to set up alert thresholds for 5XX status codes. |
log_count.debug | The number of log messages of different severities. Pay attention to the fatal/error/warn levels. A good candidate for setting up alert thresholds. |
UAA
| Metrics | Description |
|---|---|
user_authentication_failure_count | The number of failed user authentication attempts since the last start of the UAA process |
user_not_found_count | The number of times a user was not found since the last start of the UAA process |
user_password_changes | The number of successful password changes by a user since the last start of the UAA process |
user_password_failures | The number of failed password changes by a user since the last start of the UAA process |
These metrics are good candidates for setting up security alert thresholds.
Application metrics
There are several more components inside Cloud Foundry that do not stream metrics via Firehose, but also need monitoring to assure flawless operation of your Cloud Foundry deployment (e.g., internal MySQL/PostgreSQL, HAProxy, or NGINX).
See the Monitoring third-party services section to get an idea of how to retrieve metrics from such components.
The container metrics and HTTP events from applications are also streamed via Firehose and, hence, are available on Cloud Foundry out of the box.
System metrics
| Metrics | Description |
|---|---|
CPU | CPU usage |
Memory | Memory usage |
Disk | Disk usage |
HTTP metrics
| Metric | Description |
|---|---|
responses.XXX | The number of the HTTP response status codes of type XXX (it makes sense to convert them to rate) |
In addition, you can derive some useful metrics from the HttpStartStop event inside a nozzle.
To do so, you need to use the ApplicationId field inside the HttpStartStop struct to map a request to a particular application. StartTimestamp / StopTimestampStatusCode to distinguish good responses from the bad ones.
| Metrics | Description |
|---|---|
request | The number of good HTTP responses |
error | The number of bad HTTP responses |
response times | Application response time |
You can retrieve more technical metrics by using certain buildpack internals (e.g., JMX integration, APM agents, etc.). To get business metrics, you can define them inside the application and then send to a metrics receiving system (e.g., a statsd daemon).
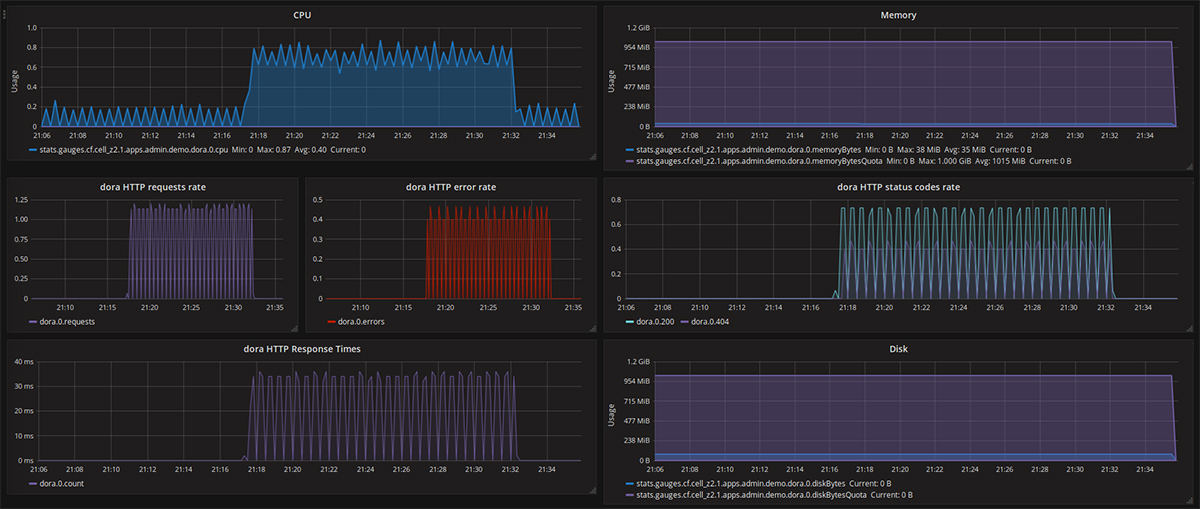 Application metrics visualized
Monitoring third-party services
Some services (e.g., RabbitMQ or Redis) stream metrics via Firehose, so all you need to start monitoring them is deploy a Firehose nozzle. With the services that do not send metrics to Firehose, things get a bit more complicated. You need to gather metrics on your own, know where to collect them from (e.g., IP+Port) and, probably, what the credentials are. Hopefully, there are lots of metric collectors featuring a predefined integration with a great number of services. Thus, you need to install the agent on the service and create a proper auto-configuration (e.g., based on a BOSH manifest file).
Similarly, you can monitor the Cloud Foundry components that do not stream metrics via Firehose (e.g., internal MySQL/PostgreSQL, HAProxy, or NGINX).
All the dashboards in the blog post were taken from Heartbeat—a monitoring tool containing all the mentioned metrics and many others.
Further reading
- Introducing Heartbeat, a Full-Stack Monitoring Tool for Cloud Foundry
- Altoros Heartbeat Adds Full-Stack Monitoring for Pivotal Cloud Foundry