Using Centralized Logs and Metrics to Monitor Cloud Foundry Across All Levels

Understanding a complicated system
Cloud Foundry deployments are complex ecosystems involving multiple layers, such as IaaS, BOSH, Cloud Foundry itself, applications, and backing services. As cloud operations and DevOps engineers, it is vital to know how each of these components work to be able to troubleshoot errors after they occur, or better yet, prevent them from happening altogether.
 A Cloud Foundry monitoring workflow
To be able to do so, setting up a monitoring system is the first step. Monitoring is an essential part of development because it enables us to:
- Look at the individual parts of the system
- Pinpoint issues and fix them before clients find them
- Measure statistics over time
So, what’s needed to do so?
Configuring centralized logs
Cloud Foundry deployments can easily be scaled up on demand, so it’s ideal to configure centralized logging. This will simplify such tasks as:
- Data search and manipulation. Finding and parsing information is more convenient as all the logs are in a single place.
- Long-term storing. Servers usually delete logs after a set period of time. Having centralized logs makes it easier to store them in a dedicated storage space.
- Reporting. Dashboards, reports, and alerts can be created using information from centralized logs.
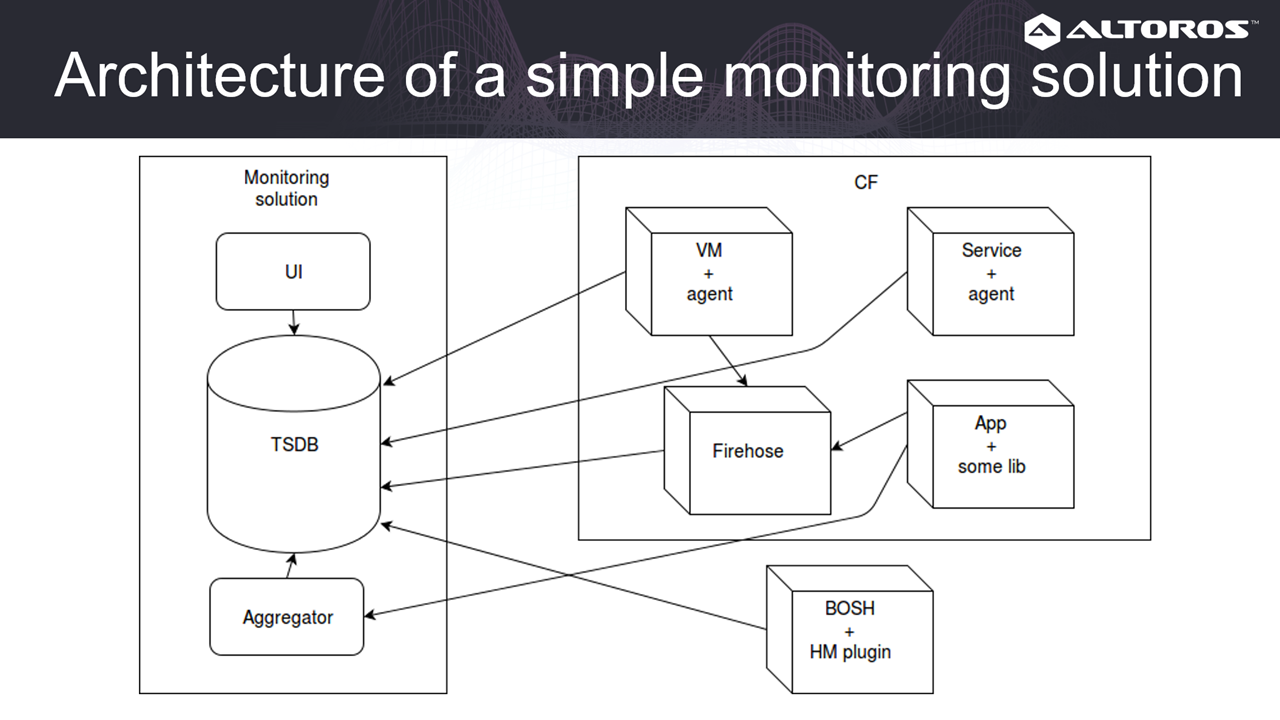
In the image below, we can trace how applications generate logs. In this case, applications pass their metrics to a Metron agent. This gets forwarded to Doppler and then Traffic Controller. Next, Traffic Controller exposes the data to Firehose, which is a websocket, where we can connect and receive messages. At the same time, platform logs are written into rsyslog and then can be forwarded to your separate syslog receiver.
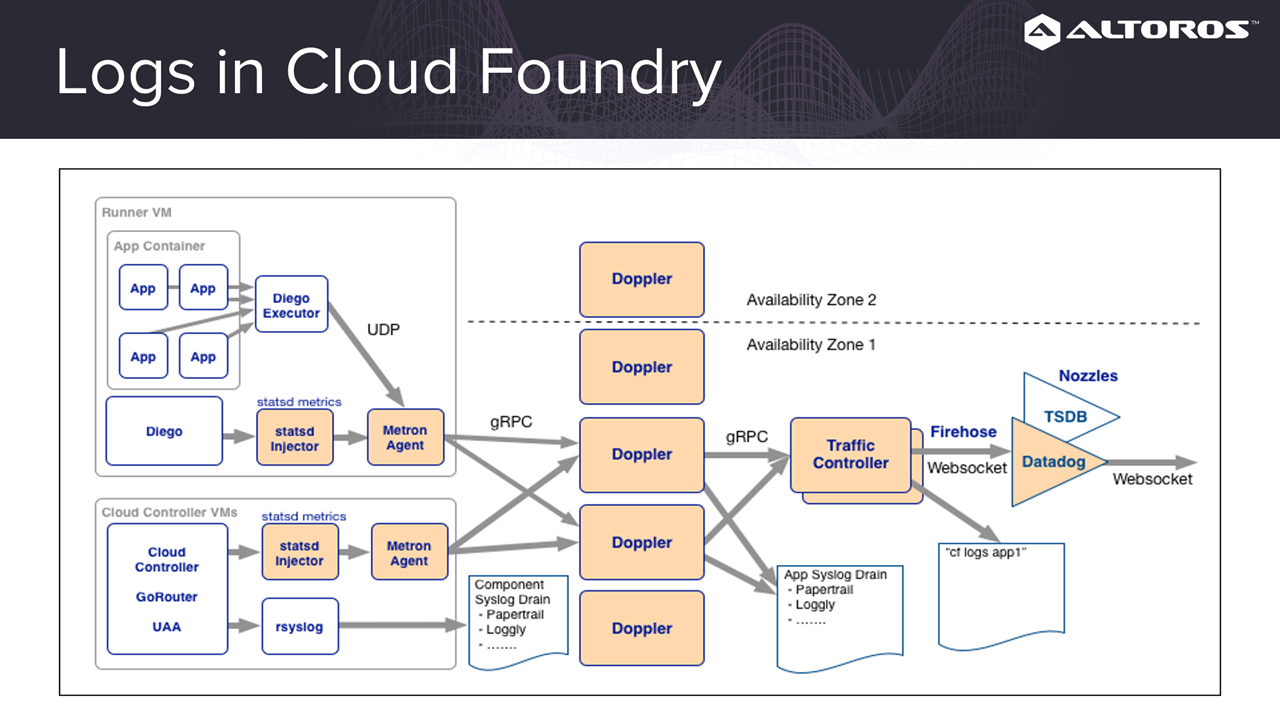 An architecture of logs in Cloud Foundry
Logs are basically just lines of text in different formats. For storage, it is optimal to use a database with dynamic fields, indexing, and convenient searching (such as Elasticsearch).
Before the logs are stored, we need to be able to parse them to get useful information. Since we’re getting logs from multiple sources, we’ll need a parser (e.g., Logstash) than can understand different formats.
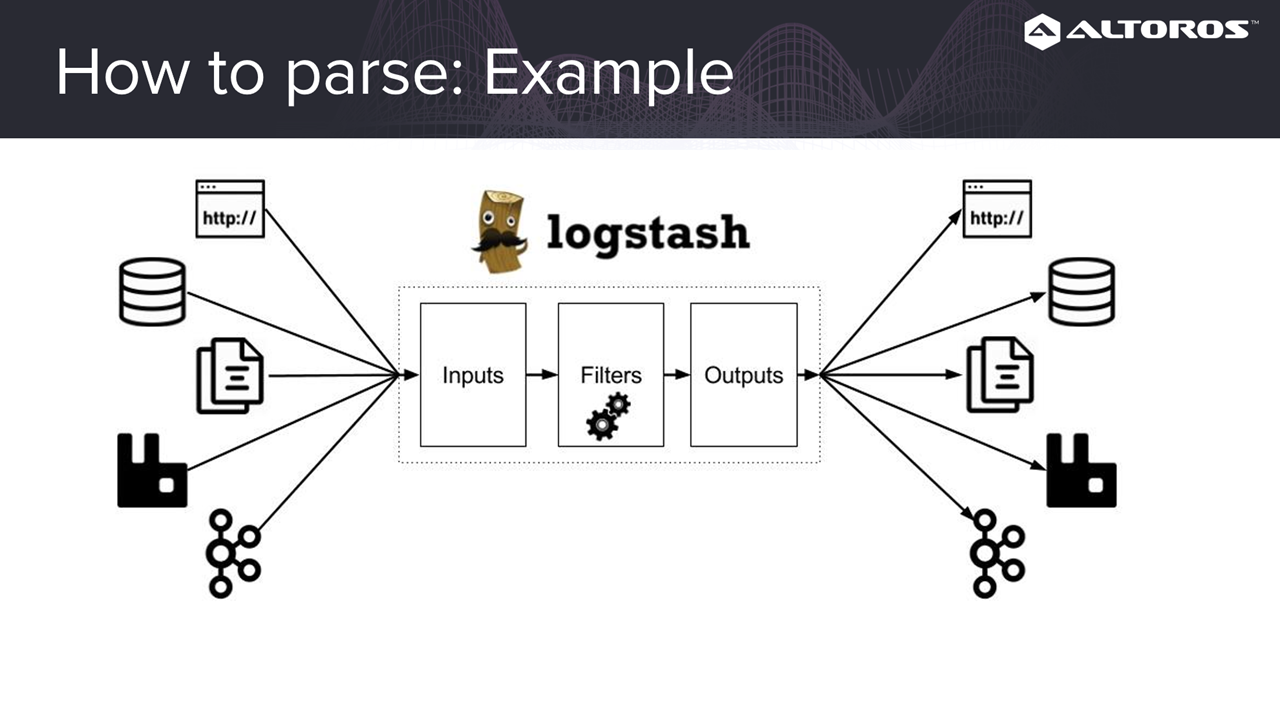 Logstash supports multiple formats
After the logs are parsed, we’ll need an interface (e.g., Kibana) to be able to see any relevant information.
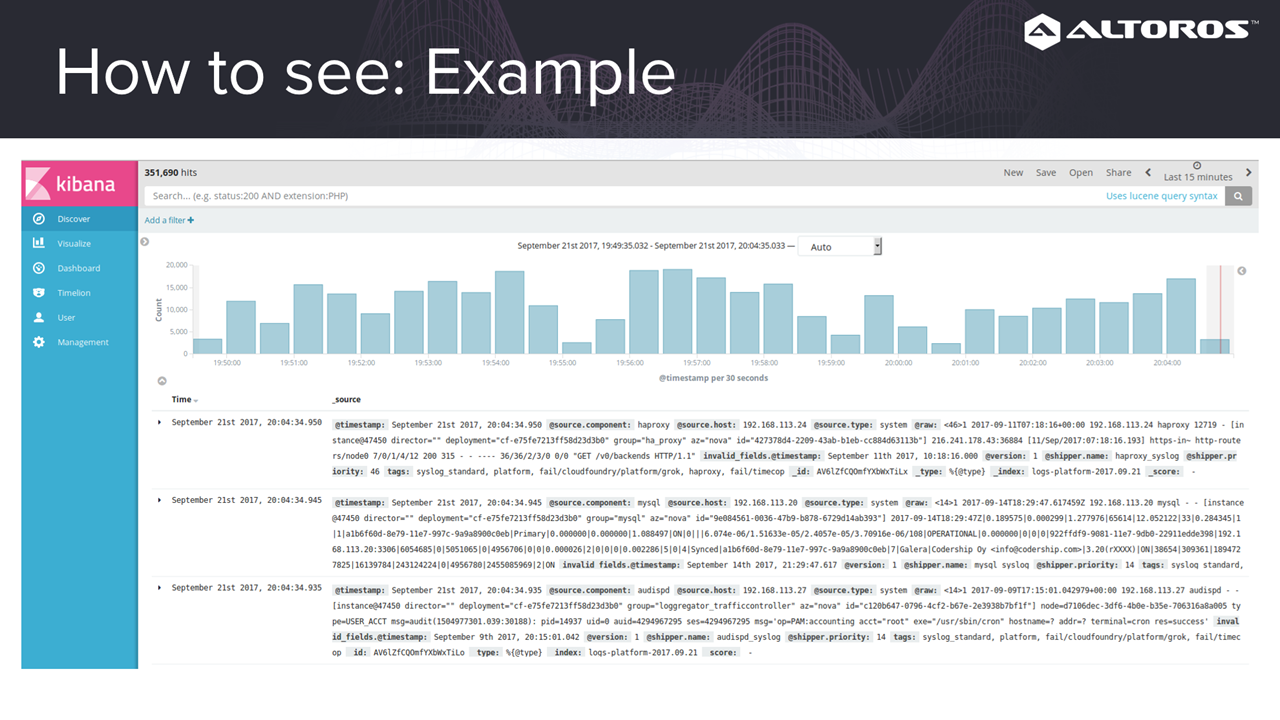 Kibana has a dashboard, which includes graphs
As we can see, plenty of work is involved in just having to set up logs in Cloud Foundry. Luckily, ready-to-use solutions are now available: Logsearch for open-source deployments and Altoros Log Search for Pivotal CF deployments.
To improve log management:
- Decrease log level. By default, most Cloud Foundry components have a high log level that includes debug data. Setting this lower helps to avoid the overload of information.
- Use the JSON format. Logs in the JSON format are easier to understand and parse, so you might want to consider using it for your application logs.
Configuring metrics
After setting up centralized logs, the next step in creating an ideal monitoring system is to include metrics. Simply put, metrics is a collection of data distributed over time. Metrics enable more advanced analysis, for instance:
- Creating measurements and proving assumptions
- Planning ahead based on predictions
- Setting up alerts based on historical data
A typical metrics workflow involves collection, storage, visualization, and analysis of data. Commonly, there are two main models of collecting data:
- Push. Metrics collectors of each component send information to a time-series database.
- Pull. Components have the internal capability to expose metrics at endpoints that can be read by crawlers.
Next, data is stored in a time-series database (e.g., Graphite) and visualized with an analytics tool (e.g., Grafana).
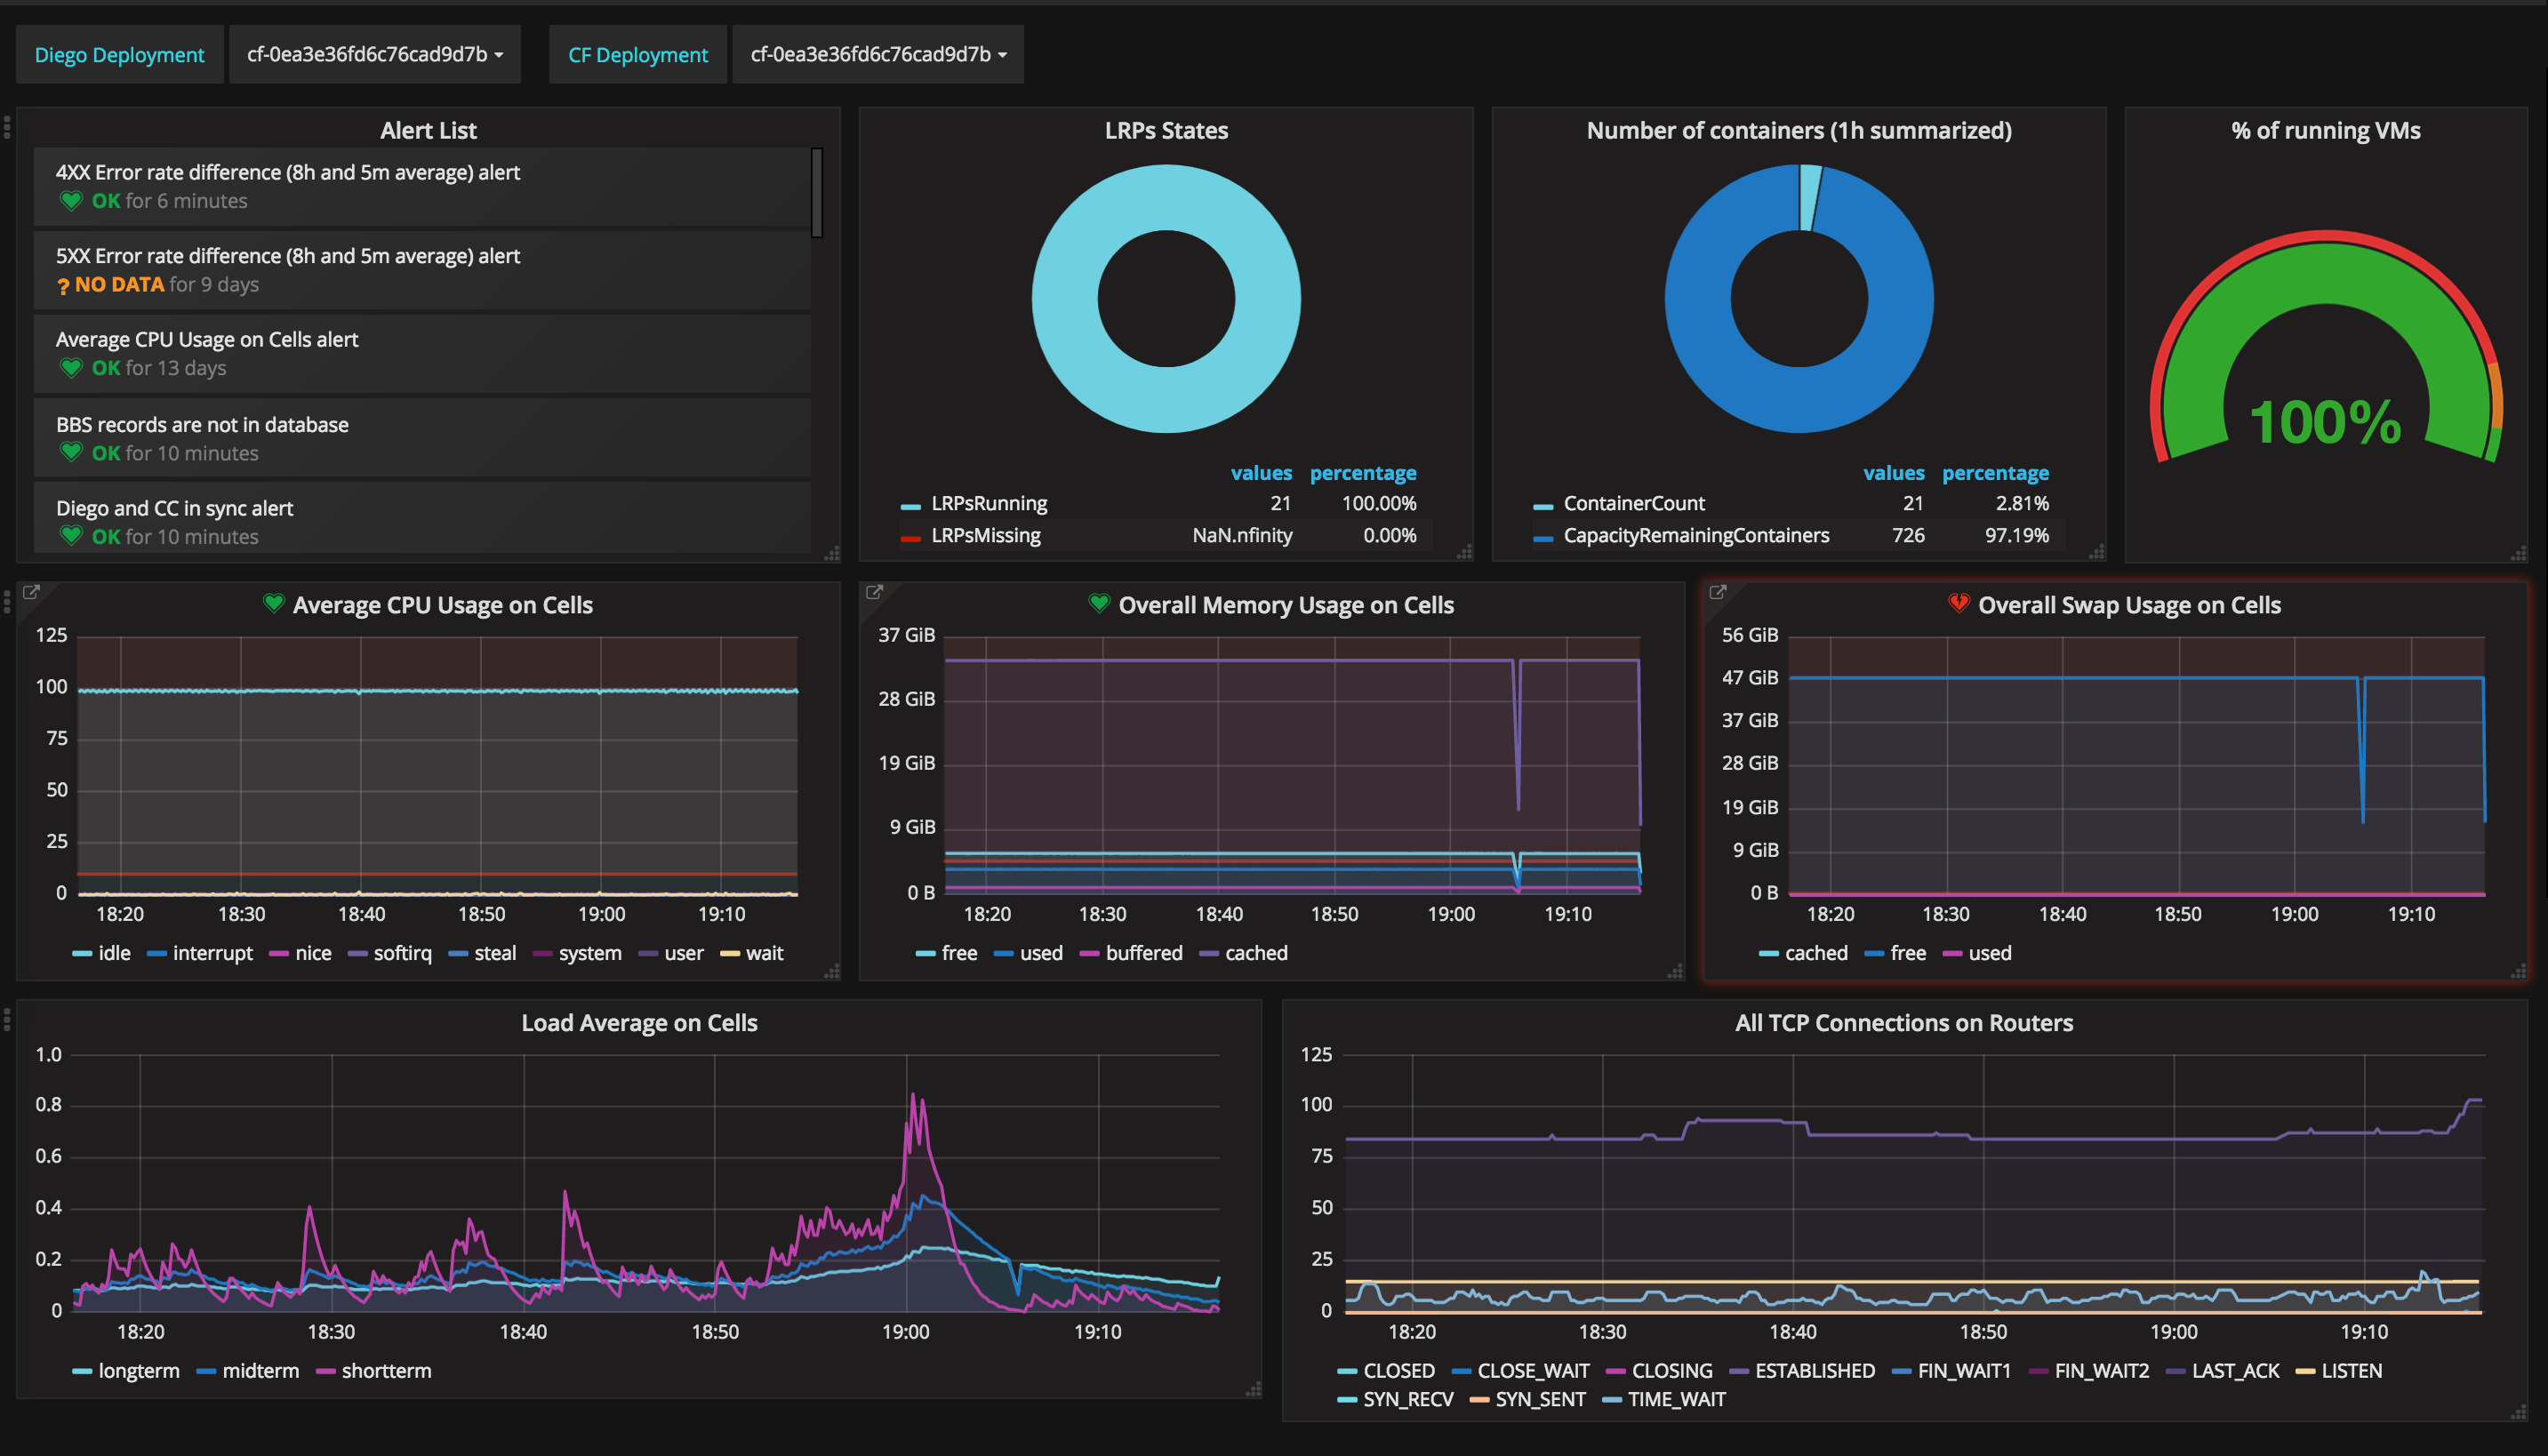 A monitoring dashboard of Altoros Heartbeat using Grafana for visualization
Finally, to get any value from the metrics collected, we need to understand and use the data. There are two approaches to analyzing information:
- Reactive. Alerts can be configured, so we can troubleshoot after an event occurs.
- Proactive. Using historical data and trends, issues can be predicted and avoided before they even happen.
Full-stack Cloud Foundry monitoring
As already mentioned, Cloud Foundry deployments include several layers. Each and everyone of these layers have metrics that can be collected and monitored.
In most cases, we can collect metrics from the IaaS itself using internal API or through vendor-specific monitoring systems for proprietary solutions. We can also collect data from virtual machines via metrics collectors.
In Cloud Foundry, almost everything is deployed using BOSH, so it’s important to monitor BOSH itself. This can be achieved with the following tools:
- BOSH Health Monitor provides such metrics from virtual machines as CPU, memory, and disk usage.
- BOSH HM Forwarder forwards BOSH health metrics to Firehose, enabling all metrics to be located in a single place.
- PCF JMX Bridge exposes metrics through the JMX protocol.
Note that these tools only provide basic information and should not be used as a replacement for more comprehensive metrics collectors.
Next, one would also want to monitor Cloud Foundry and its components. Metrics for Cloud Foundry itself, as well as native Cloud Foundry and third-party components can be collected through Firehose.
Some third-party components are not compatible with Firehose and may need an external metrics collector, such as collectd.
Previously, pulling API endpoints for gathering metrics was quite common for monitoring Cloud Foundry components. However, it is better not to use this approach anymore, as some of the endpoints are already deprecated.
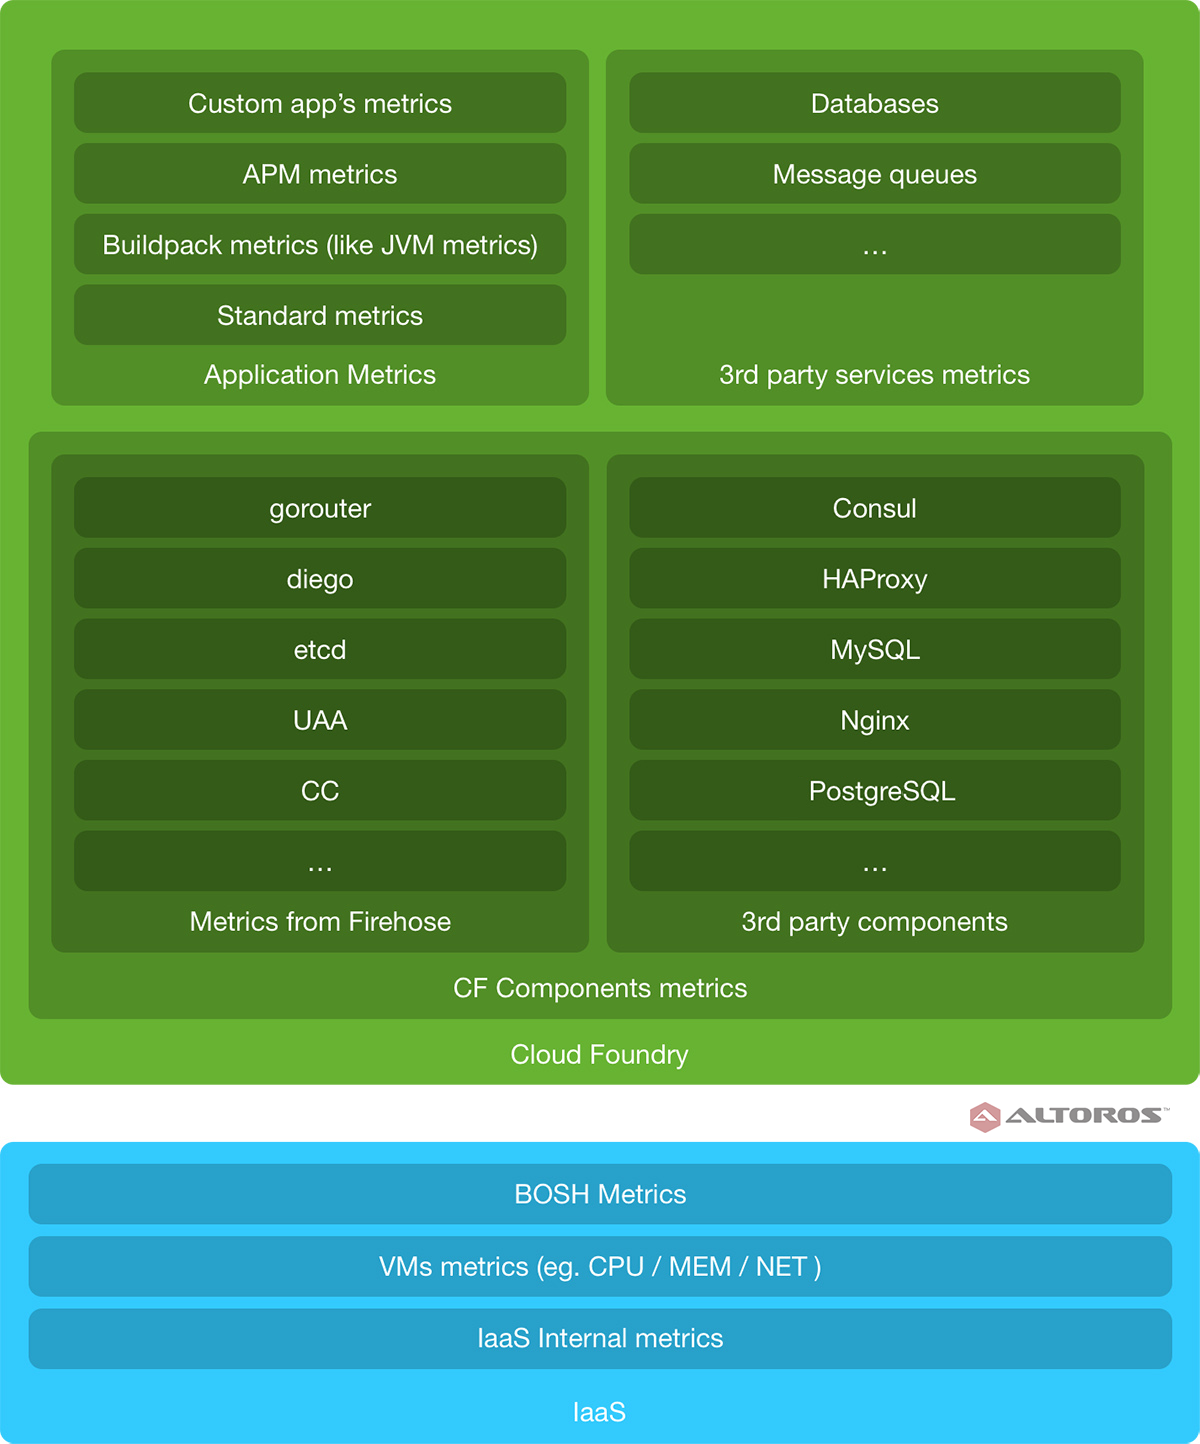 Monitoring Cloud Foundry at all the levels
Cloud Foundry applications can also be monitored. There are a bunch of methods to do so:
- Use Firehose as a standard approach for collecting metrics.
- Integrate specific application performance monitoring tools with Cloud Foundry. While they are comprehensive, they can also be expensive.
- Create your own monitoring system by defining metrics in your application.
- Design custom buildpacks that collect predefined metrics.
Finally, we also want to monitor backing services. For instance, popular metrics collectors have plugins for services such as MySQL, MongoDB, and RabbitMQ. On the other hand, some services like Cassandra and Jenkins have the internal capability of exposing metrics. Some backing services deployed via BOSH push metrics through Firehose.
With metrics at every layer as well as centralized logs, the task of monitoring and troubleshooting Cloud Foundry deployments can be made less challenging. Tools such as Heartbeat and Log Search can foster the process.
Want details? Watch the recording of our webinar on Cloud Foundry monitoring.
Related slides
Further reading
- Cloud Foundry Deployment Metrics That Matter Most
- Heartbeat v1.0 Provides HA for Full-Stack Cloud Foundry Monitoring
- Altoros Heartbeat Adds Full-Stack Monitoring for Pivotal Cloud Foundry
About the expert