Tips and Tricks to Monitor a Cloud Foundry Deployment Across All Levels

What to monitor?
A real-life Cloud Foundry deployment involves several layers, starting with IaaS all the way to individual apps. Recently, we posted a tutorial on how to set up centralized logs and metrics to monitor each of the layers. Yesterday, Anton Soroko of Altoros provided more details on the topic during Cloud Foundry Summit Europe.
In his talk, Anton ploughed through each layer of a Cloud Foundry deployment, outlining which components and metrics should be tracked.
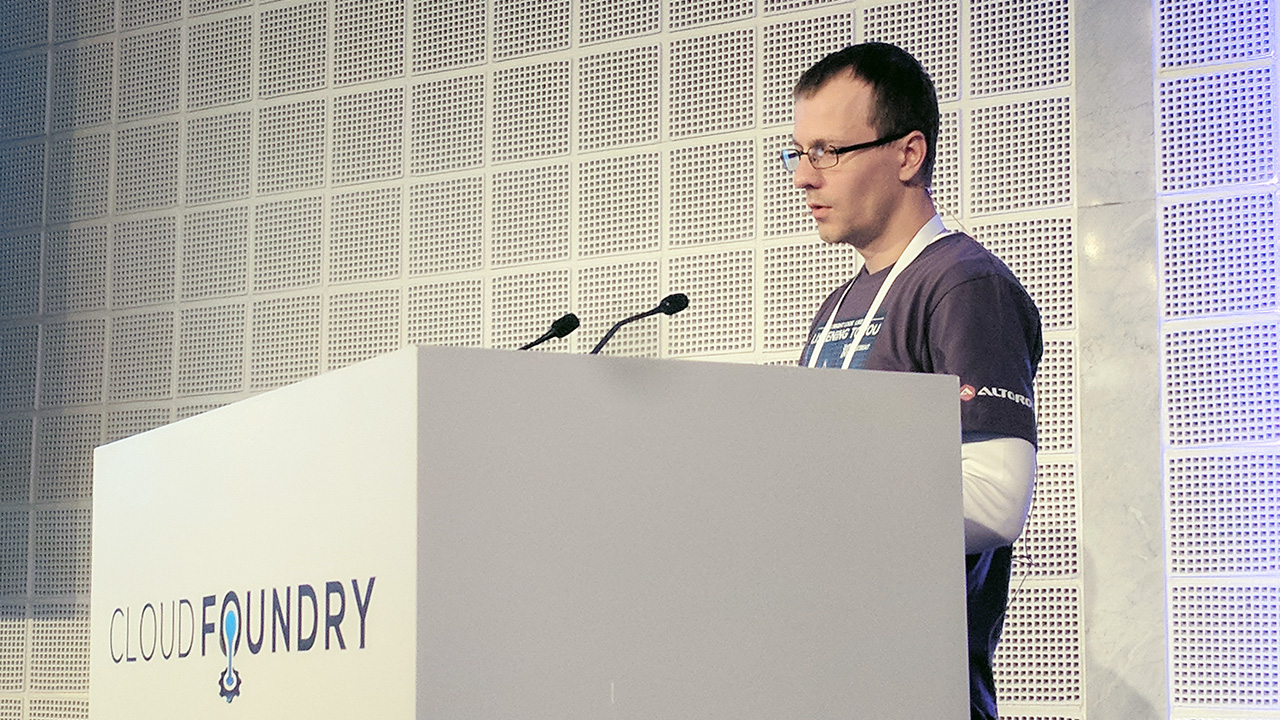
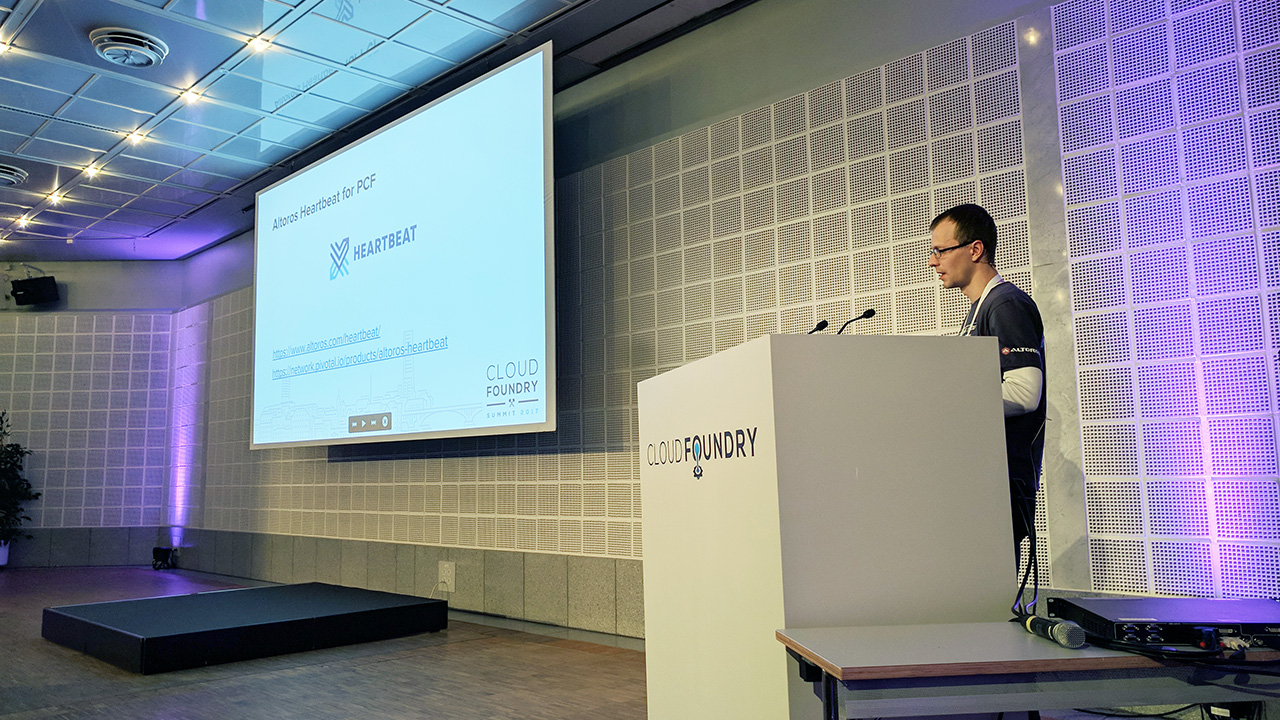
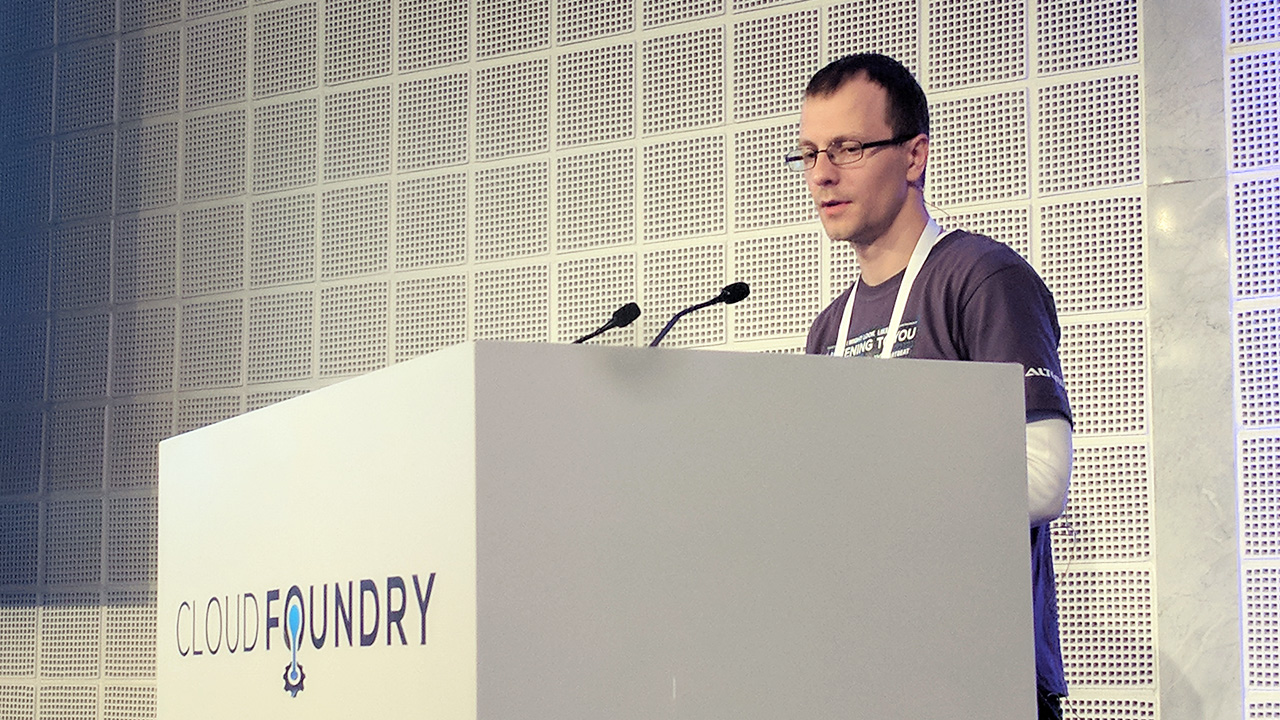 Anton Soroko at the Cloud Foundry Summit Europe 2017
According to Anton, within the IaaS layer, there is sense in monitoring availability of the infrastructure itself, including:
- Availability of data centers and availability zones
- Metrics and alerts for internal metrics (accessible through infrastructure API or vendor-specific monitoring)
In addition, for VMs at the IaaS level, Anton suggests to pay attention to:
- Readings for CPU, memory, network, as well as input and output
- Availability of the agent and host
The next crucial layer in a Cloud Foundry deployment is BOSH. By configuring e-mail notifications, you can receive alerts about processes on VMs, SSH events, deploy events, etc. Another thing to configure is the log forwarding and metrics collection. For metrics, one can make use of tools like BOSH Health Monitor and BOSH HM Forwarder, Anton says.
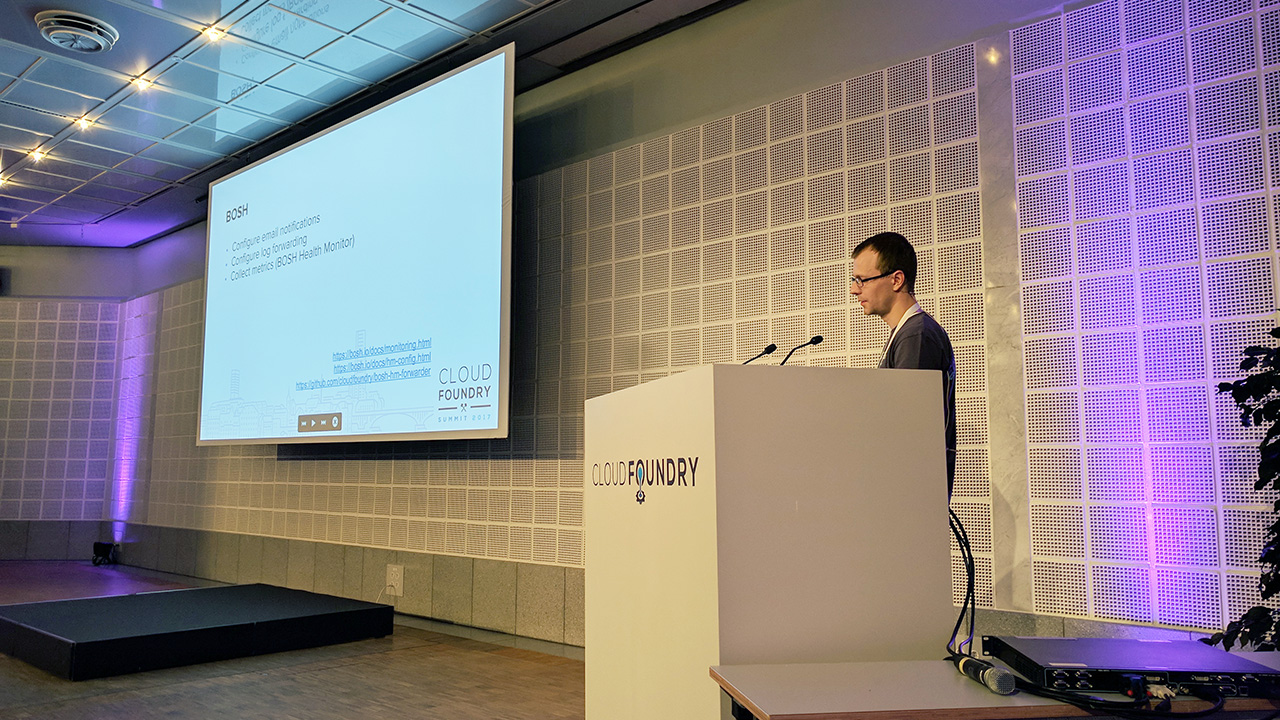
“BOSH’s Health Monitor will provide you with basic metrics from VMs and the health status of VMs. To gather more advanced metrics, use monitoring agents.” —Anton Soroko
The Cloud Foundry platform itself needs to be monitored, as well. Good practices involve:
- Collecting logs from both apps and the platform (via Firehose and syslog).
- Collecting metrics. Firehose will be sufficient for internal components, such as UAA, CC API, and Diego. For external components like MySQL and NGINX, utilize metrics collectors. (Lately, we covered which of the Cloud Foundry metrics matter most.)
- Configuring alerts based on logs and metrics.
- Configuring URL checks for UAA, CC API, etc.
“Setting up URL checks is a simple trick, but it gives you an opportunity to look at your Cloud Foundry deployment from the outside.” —Anton Soroko
For services, it is essential to collect metrics (with Firehose or metrics collectors) and configure alerts based on vendor recommendations.
When monitoring the applications layer, Anton suggests to:
- Configure URL checks
- Collect metrics by using APM or writing your own code
- Collect logs with Firehose or stream logs for specific apps only
“You can use APM to get metrics out of the box, but don’t expect these metrics to have much value automatically. Instead, write your own code and send metrics to a time-series database, so you can define metrics with real value.” —Anton Soroko
Keep services and stemcells updated
After configuring a monitoring system, it is always a good idea to keep track and install the latest versions of services and stemcells available. Updates not only add new features, but also address bugs and security flaws.
Updating can be a tedious task, so Anton recommends using a continuous integration tool, such as Concourse (which was built specifically for Cloud Foundry), or any other CI tool, such as Jenkins.
As cloud engineers, you would also want to keep an eye on the latest security threats. So, according to Anton, a new security advisory across common vulnerabilities and exposures by the Cloud Foundry Foundation will be of much help to you. Practice drills can ensure the right steps are taken in case of failure. Ideal scenarios to simulate include VM crashes, data center outages, and network issues.
“Simulations will help you to ensure that your deployment won’t let you down at the time of a real-life failure.” —Anton Soroko
Nail it with monitoring tools
Although monitoring Cloud Foundry deployments can sound complicated, there are tools available to simplify the process. Altoros has also developed a couple of solutions specifically designed for the purpose.
Heartbeat is a full-stack monitoring tool for both open-source Cloud Foundry and the Pivotal CF distribution. Now generally available, Heartbeat combines data visualization, alerting, and metrics logging capabilities to enable scrupulous full-stack monitoring.
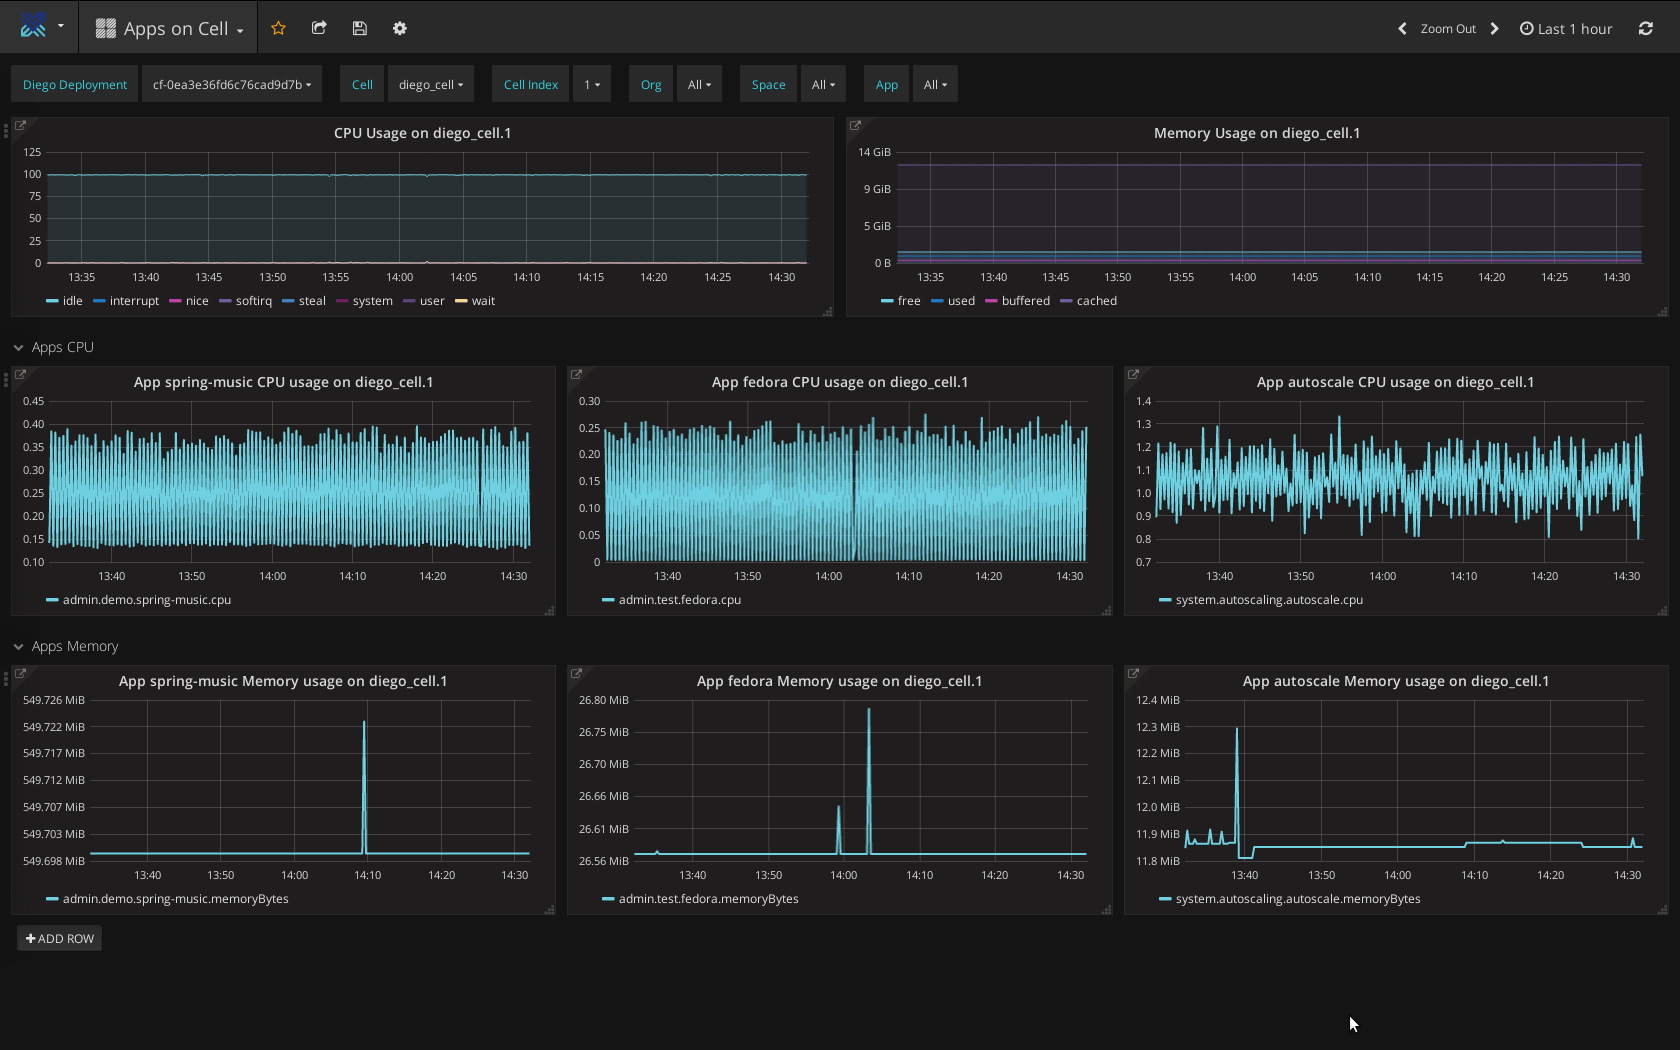 Overview of apps on a Diego Cell using Heartbeat
Log Search is another tool—offered as a PCF tile—which extends the capabilities of Elasticsearch, Logstash, and Kibana (ELK) to enable centralized log management. The tool furnishes Pivotal CF operators and developers with a set of log aggregation and parsing algorithms, simplifying:
- Collecting logs from all the Pivotal Cloud Foundry components, as well as data services available on the Pivotal Network
- Retrieving all application logs by default
- Using the Cloud Foundry UAA service to control access to Kibana dashboards based on a user role and rights within the platform
- Getting secure authorized access to Kibana dashboards useful for log analysis
General recommendations
At the conclusion, Anton provided a few more ideas to keep in mind while monitoring Cloud Foundry deployments:
- Create a knowledge base. Write postmortems and add new cases after dealing with them.
- Configure alerts for basic use cases and metrics. Set up notifications for availability, error rates, etc.
- Ensure sufficient coverage. Too many alerts and graphs will generate information noise and will disrupt your monitoring, so keep away from overdoing this.
Following these practices and recommendations, it is easier to “never leave your Cloud Foundry deployment unattended,” in Anton’s words.
(We hope, a video recording of the speech will be uploaded within a week by the CF Summit organizers. Stay tuned!)
Related slides
Further reading
- Using Centralized Logs and Metrics to Monitor Cloud Foundry Across All Levels
- Cloud Foundry Deployment Metrics That Matter Most
- Heartbeat v1.0 Provides HA for Full-Stack Cloud Foundry Monitoring
- Altoros Heartbeat Adds Full-Stack Monitoring for Pivotal Cloud Foundry
About the expert

This post was written by Carlo Gutierrez and Anton Soroko
with assistance from Alex Khizhniak and Sophie Turol.