MADlib: A Solution for Big Data Analytics from Pivotal

General overview
![]() There are a number of data analytics solutions that support the MapReduce principle and are able to work with NoSQL databases. However, most enterprises still rely on mature SQL data stores and, therefore, need traditional analytics solutions to provide in-depth analysis of their business-critical data.
There are a number of data analytics solutions that support the MapReduce principle and are able to work with NoSQL databases. However, most enterprises still rely on mature SQL data stores and, therefore, need traditional analytics solutions to provide in-depth analysis of their business-critical data.
MADlib is a scalable in-database analytics library that features sophisticated mathematical algorithms for SQL-based systems. The solution was developed jointly by researchers from UC Berkeley and engineers from Pivotal (formerly EMC/Greenplum). It can be considered as an enterprise alternative to Hadoop in machine learning, data mining, and statistics tasks. In addition, MADlib supports time series rows, which could not be processed appropriately by Hadoop, greatly extending capabilities for building prediction systems. For more information, watch a video overview from Pivotal, read the introduction to MADlib, or visit the product page.
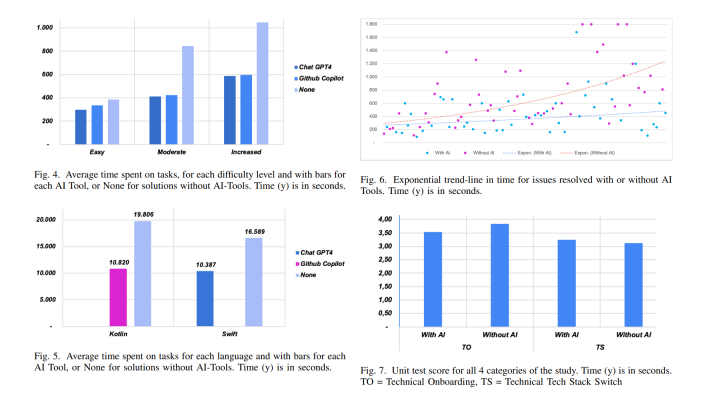
With some experience in Wolfram Mathematica, we were tempted to compare the two products. The presentation that claimed MADlib’s high performance and great scalability of the built-in machine learning algorithms even boosted our curiosity. Below is one of the slides taken from this document. The solution is supposed to process billions of rows in minutes, impressive math!
 The MADlib data processing method
Installation
There is a detailed official installation guide, so we faced no difficulties while installing the product. We used the most recent (at that time) MADlib v1.3 and PostgreSQL v9.2 for one CentOS node. When installation was finished, we wanted to check out whether the algorithms worked properly. For that purpose, it is good to have test data samples, but they were not included. So, right after installation, we had to spend some time to find data to test the solution. It would be great if such sample data sets were added to enable users to play with a product and see how it works.
Clustering
Firstly, we wanted to see how MADlib deals with basic tasks. We decided to start with k-means clustering. A classic wine data set downloaded from the UCI archive was taken as a test database. Initially, there were two files with wine characteristics. They were merged into a single database that had 6,497 records and 14 columns.
According to the notes in the developer documentation, data had to be presented in the following way before starting the algorithm.
1 2 3 4 5 6 | {TABLE|VIEW} data_points ( ... [ point_id INTEGER, ] point_coordinates {SVEC|FLOAT[]|INTEGER[]}, ... ) |
Coordinates of a point are to be stored as an array in a single column of the table. Usually, each coordinate is stored in a separate column. Therefore, data should be somehow transformed from this view into a table, in which all coordinates are stored in one column. For a data science specialist with little experience in PostgreSQL, it turned into a challenging task.
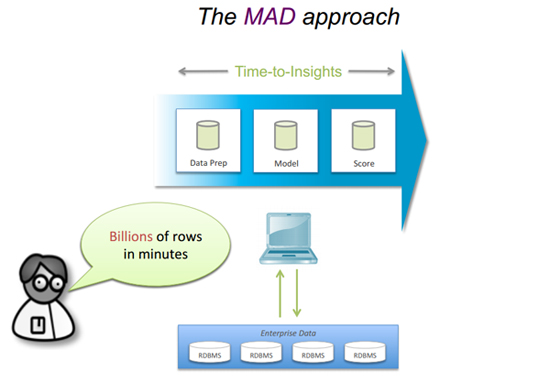
After the data had been presented in the required way, the algorithm started easily. The results (only centroids) were compared against the results demonstrated by the same algorithm included in Wolfram Mathematica. The figure below demonstrates the clustering results of Wolfram Mathematica (black centroids) vs. MADlib (red centroids). Although there were some slight deviations, they were within the acceptable limits.
 Comparison of k-means algorithms
Linear regression
To evaluate the linear regression algorithm, the same table with wine characteristics was utilized. Although the type of a matrix was not defined in the documentation, there was an example of how to call a function. It could be concluded that no data transformations were required.
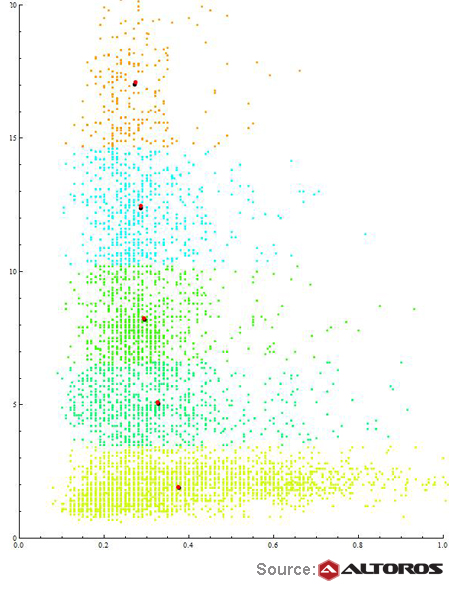
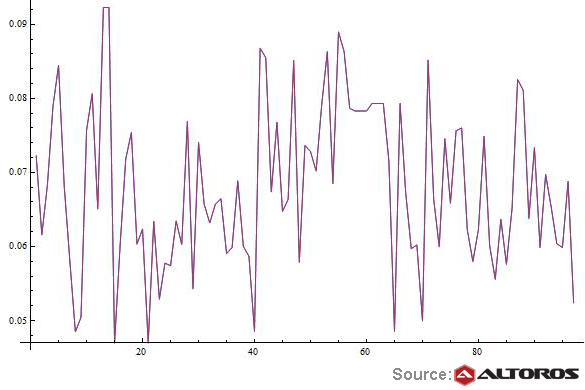
The system used the titles of the columns with dependent and independent variables as input data for this algorithm, which is quite natural for this kind of task. The whole data set was divided into training and test samples (6,400 and 97 records respectively). The algorithm successfully handled the task. The predicted results (the blue curve) were compared against the real ones (the purple curve).
 MADlib linear regression
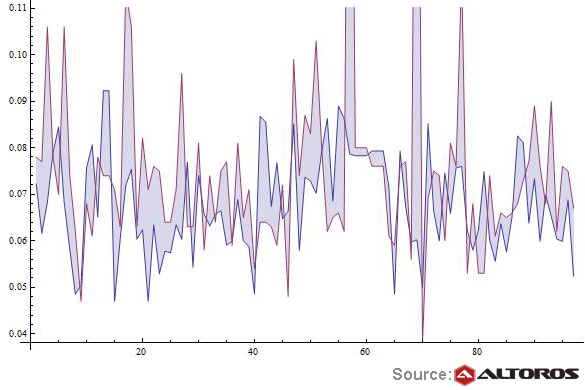
The eventual results were quite predictable. Below, you can see two line charts that show models built with MADlib (the purple curve) and Wolfram Mathematica (the blue curve). Since two charts overlapped, there is a single blue-purple line.
 A comparison of linear regression models
In addition to clustering and linear regression, we also examined MADlib’s implementation of singular value decomposition (SVD) of a sparse matrix and time series analysis. If you are interested in the results, drop us a line.
Did you have any chance to work with MADlib? What was your experience?
About the author

Further reading
- Building Stock Trading Strategies: 20% Faster with Hadoop
- Implementing k-means Clustering with TensorFlow
- Hadoop-based Movie Recommendation Engine: A Comparison of the Apriori Algorithm vs. the k-means Method