Introducing Heartbeat, a Full-Stack Monitoring Tool for Cloud Foundry

Today, we are exited to announce the launch of Heartbeat, a full-stack monitoring tool built specifically for Cloud Foundry. With integrated logging, alerting, and visualization, the product helps to evaluate a real-time status of Cloud Foundry deployments—from VMs and containers to services and apps.
Users can build upon predefined, easily configurable data visualization panels, by creating their own dashboards for general overviews or close-ups to get all key metrics in one place.
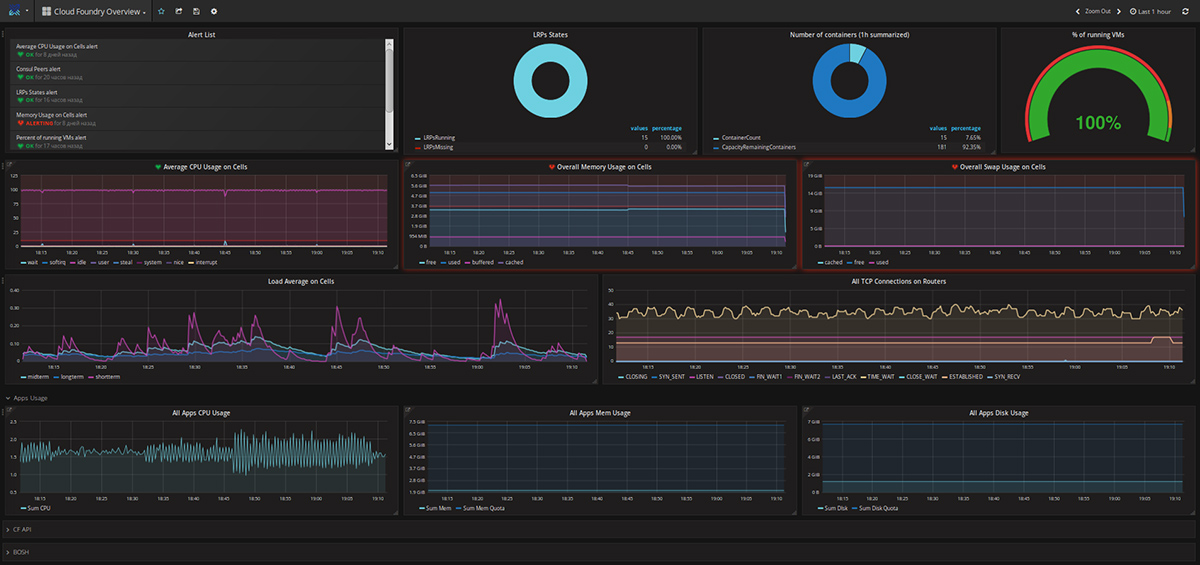 Overall Cloud Foundry deployment overview
What makes Heartbeat different from other monitoring tools? These points combined within a single solution:
- Designed specifically for Cloud Foundry
- Monitors the full deployment stack
- Checks the status of Cloud Foundry internal components
- Tracks application and service metrics
Monitoring throughout the stack
In addition to overall deployment overview, Heartbeat has several other detailed dashboards designed to make it a comprehensive solution for Ops and Devs.
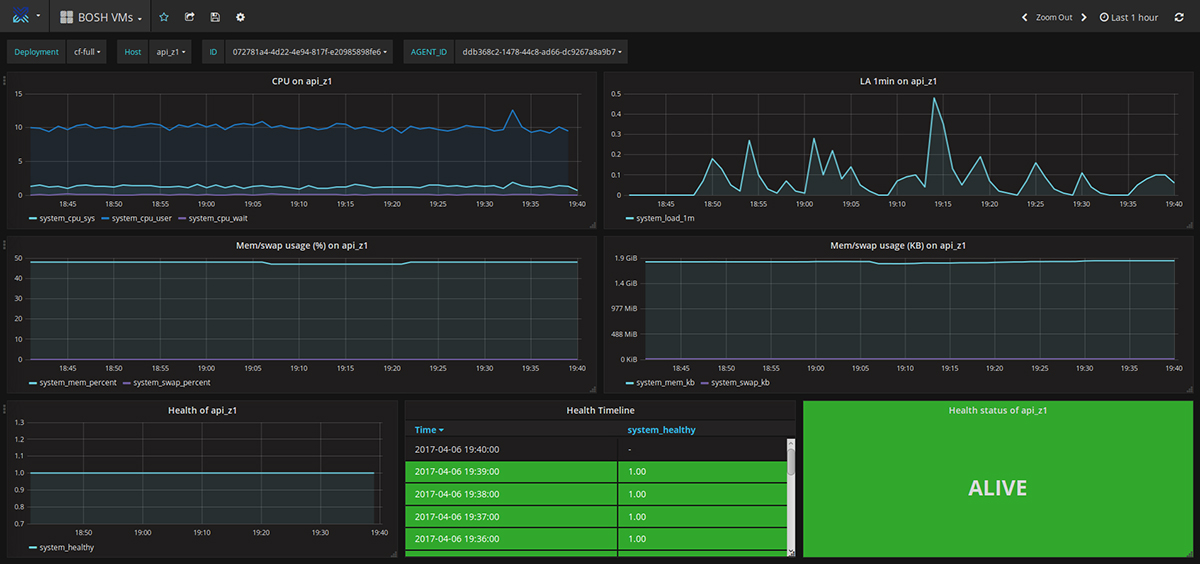
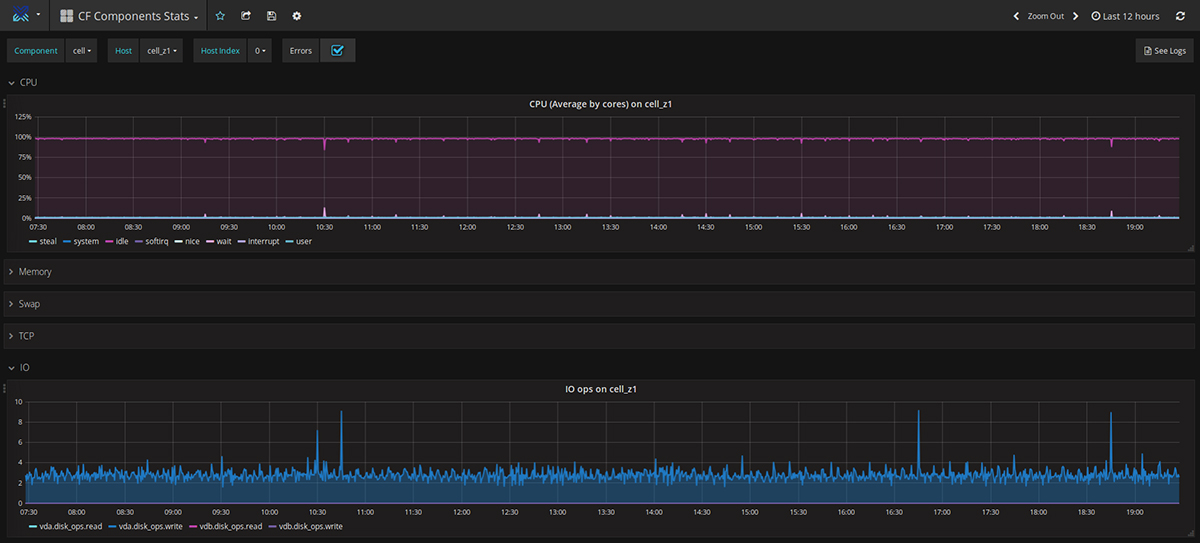
IaaS-level monitoring. Ops can view the full set of metrics from the BOSH Director and the virtual machines created and deployed by it (CPU, memory usage, IO, network, VM states, and more), regardless of the underlying infrastructure (AWS, OpenStack, vSphere, GCE).
Internal components. With the help of a Graphite Firehose Nozzle, the solution collects metrics emitted by the core, internal components of Cloud Foundry, such as Gorouter, Cloud Controller, Diego, etc.
External components. In addition to metrics collected from the core Cloud Foundry components, the solution allows for metrics collection from other components used by a Cloud Foundry deployment (e.g., PostgreSQL, NGINX, etcd, Consul, etc.).
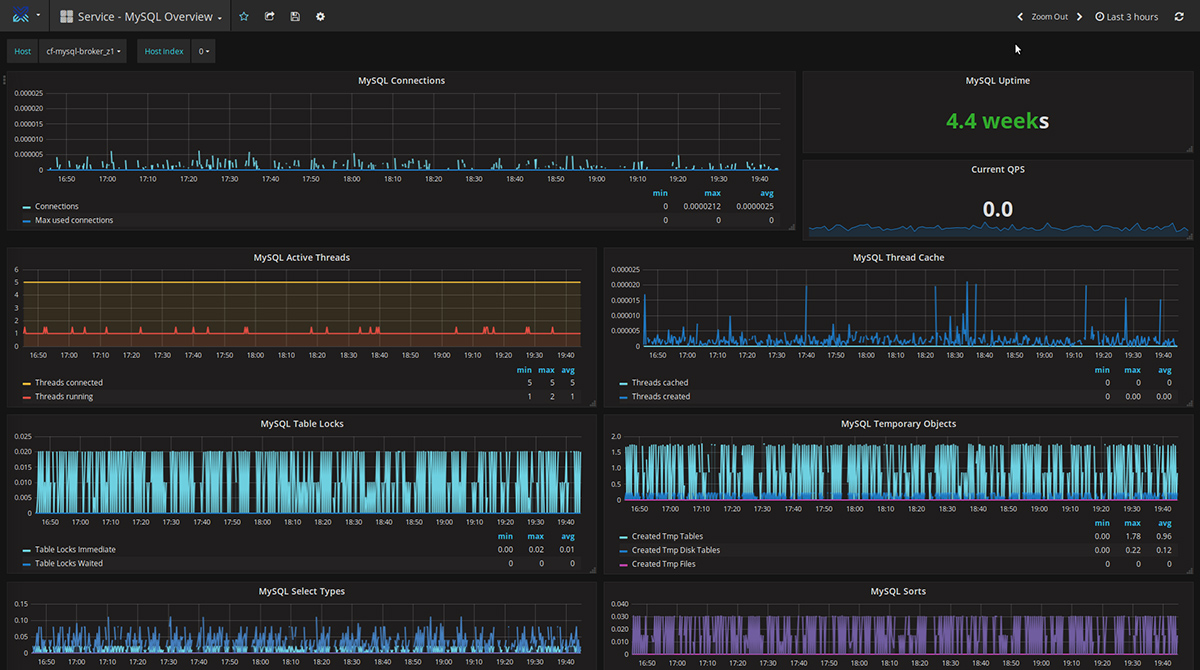
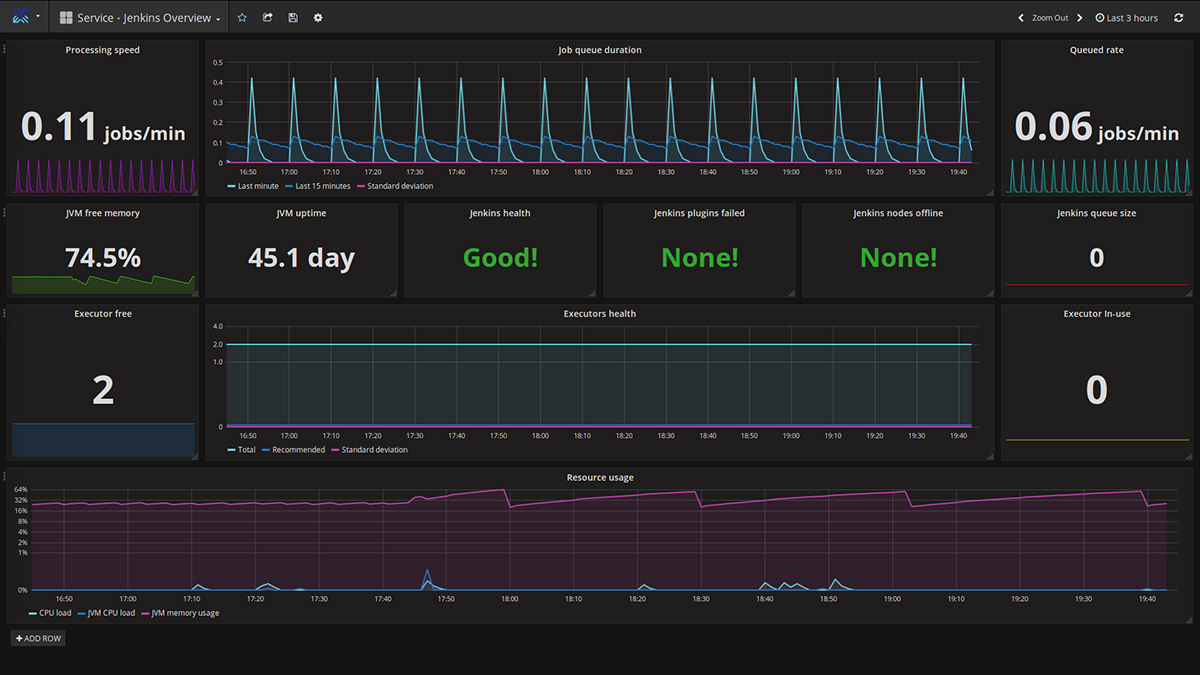
Third-party services. The solution facilitates metrics collection from third-party services, such as databases, message queues, and caches (Cassandra, MongoDB, RabbitMQ, Redis, Jenkins, Concourse, etc.)—visualizing them in a single interface.
Application monitoring
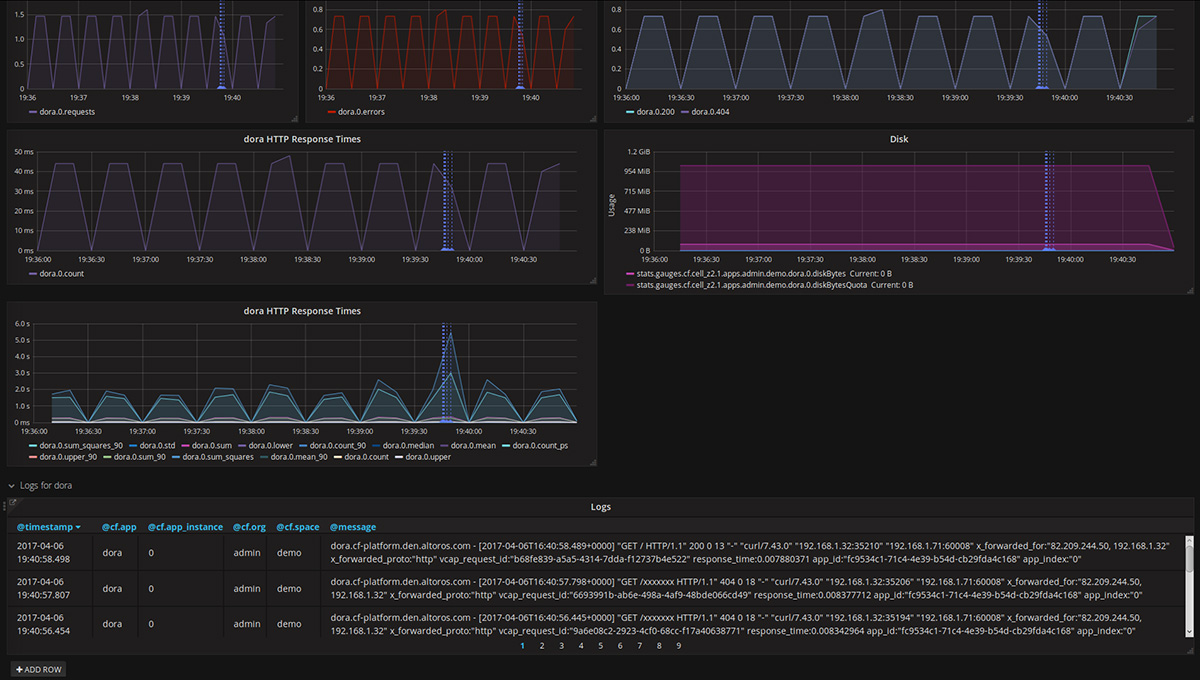
At the application level, Heartbeat is capable of monitoring the following sets of metrics:
Standard metrics. Information about each application instance’s container CPU, memory, and disk usage, as well as memory and disk quotas are available.
HTTP-specific metrics. Out of the box, the solution provides metrics like requests per second, status codes, and errors.
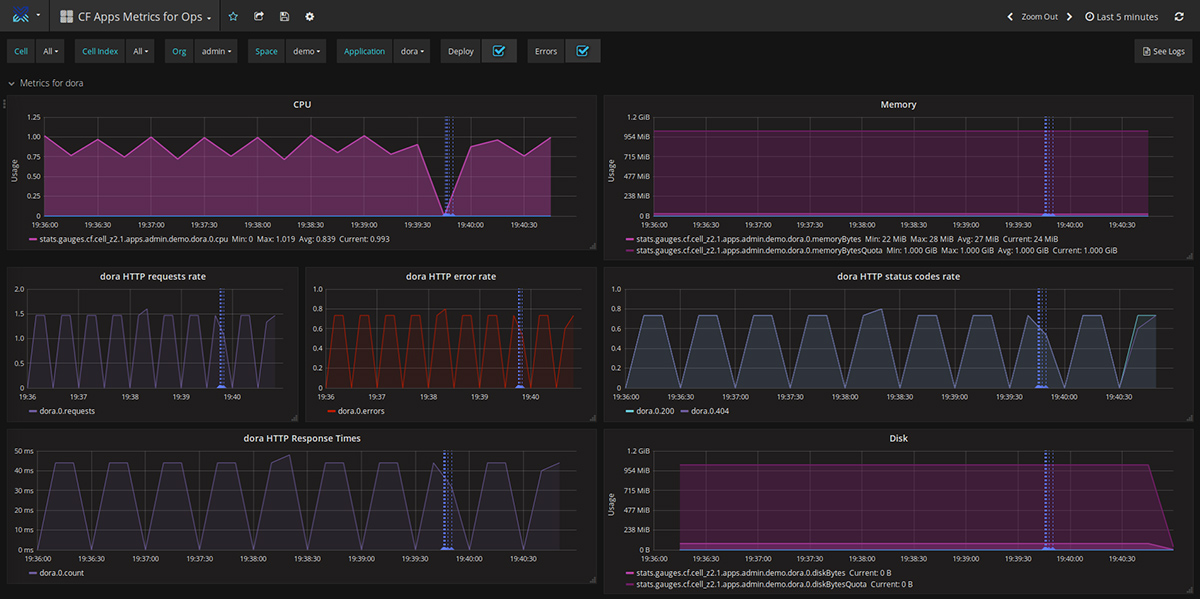
Custom metrics. Using a StatsD agent for this solution, Heartbeat collects application-specific metrics, as defined by developers. Developers include their language-specific StatsD library and with a few lines of code can emit custom metrics to the monitoring system. Metrics types collected include counters, timers, and gauges.
Integration with buildpacks. Heartbeat makes it possible to metrics via Java Management Extensions (JMX) for every Java application running in a Cloud Foundry deployment using our custom buildpack.
Users can set up alerts for each dashboard panel and get only valid notifications to immediately act upon. They can configure the frequency of evaluating alert rules, define thresholds, and set conditions that trigger Slack, e-mail, or webhook notifications.
Other technical details
Heartbeat has been designed with several key features to ensure ease-of-use and a superior user experience.
Single Sign-On. The solution uses Cloud Foundry’s User Account and Authentication (UAA) service to control access to apps and resources based on user roles and rights within the platform.
Multi-tenancy. Multi-tenancy is implemented according to Cloud Foundry UAA roles. Dedicated shares of the solution are deployed to different spaces to collect metrics from the apps and services running within.
Deployment with BOSH. Similarly to Cloud Foundry, all solution components are deployed and managed with BOSH. Also, a set of BOSH manifest snippets are available as predefined configurations.
Integration with ELK. Heartbeat’s built-in integration with the ELK log analysis stack, encompassing Elasticsearch, Logstash, and Kibana) enables developers and operators to trace detected deviations and anomalies back to their origin right from the monitoring dashboard.
Heartbeat is now available for OSS Cloud Foundry deployments and will later be adapted for Pivotal Cloud Foundry and other Cloud Foundry distributions.
For more on Heartbeat, sign up for a demo at www.altoros.com/heartbeat.
Related video
Further reading
- The Ecosystem of PCF Tiles: Easier Deployment and Upgrades
- Altoros Heartbeat Adds Full-Stack Monitoring for Pivotal Cloud Foundry
- Cloud Foundry Deployment Metrics That Matter Most